Data from this report was collected through a search of available literature. The research was supported by funding from the New York Life Foundation.
This ACM Trends report looks at how children’s museums can harness the therapeutic power of play to benefit the many bereaved children who walk through their doors every day. It also highlights two other actions children’s museums can take to provide for the needs of the bereaved: capacity building and resource sharing. The guidance offered here builds on Trends Report 8.1, which surveyed recent literature on bereaved children’s needs and the kinds of experiences that can help them overcome the grief associated with the death of a loved one. By leveraging the therapeutic power of play, building their own capacities for recognizing and responding to loss, and mobilizing existing community resources, children’s museums can contribute to the growth of new, community-driven modes of caring for the bereaved.
Data from this report was collected through a search of available literature. The research was supported by funding from the New York Life Foundation.
Experiencing the death of a loved one is a distressingly common reality for children. The most recent data from Judi’s House (an organization dedicated to providing comprehensive support services to grieving children and their families) indicates that one in twelve children in the US will lose either a parent or a sibling by the time they turn eighteen (Judi’s House, 2024). Rates of bereavement are even higher for children in racially and ethnically minoritized groups, and for those living in socioeconomically marginalized families.
Children’s museums can help facilitate bereaved children’s grieving processes. In support of this goal, this Trends report presents key research findings from the literature on bereaved children. As the first in a new series focusing on childhood bereavement, this report offers a foundation for bereavement interventions by explaining key concepts, highlighting bereaved children’s needs, and sharing general information on the kinds of experiences and supports that can help children overcome the grief associated with the death of a loved one
Data for this report was collected through a search of available literature. This research was supported by the Institute for Museum and Library Services.
The world is designed for mobile media, including smartphones and tablets, and young children are already using these tools in a range of settings. This ACM Trends report summarizes what is currently known about the ubiquity of mobile media in young children’s lives, including the caregivers’ decisions about their children’s use. We end with a consideration of how children’s museums might take advantage of current uses. This report builds on ACM Trends 7.1, which explored general principles of digital media that supports powerful learning.
This report is based on a review of the research literature. We read dozens of empirical reports and peer-reviewed articles about early childhood media use, from university researchers and organizations like Sesame Workshop, PBS KIDS, Common Sense Media, the National Association for the Education of Young Children, the Fred Rogers Institute, and the American Association of Pediatrics. One challenge in reviewing this research is a lack of consensus definitions. That means we took a broad view and included any research about media content for young children delivered over the internet, from synchronous digital programming and live video calls to games and apps.

Data for this report was collected through a review of existing literature. This research was supported by the Institute for Museum and Library Services.
When designed well, virtual programming and online experiences can facilitate meaningful learning moments in early childhood.
This ACM Trends report focuses on these digital media as one educational tool in the museum toolkit. Several well-regarded early childhood organizations have endorsed particular uses of media even for very young children, and we explore the principles and the research behind them before turning to criteria that can help identify when media is the right tool. ACM Trends 7.2 will build on this report by looking at empirical questions that must inform design: how often children use media, which children use media, and where children use media.
This Trends report reviews the research findings and concludes with practical advice for children’s museums seeking to design meaningful digital media experiences for young children.
Data for this report comes from two surveys. That pertaining to children’s museums’ collaborations with libraries was collected through the Spring 2023 ACM Member Collaborations survey. The dataset contains information from 59 member institutions. Data on library collaborations with museums was collected through a NILPPA survey of US libraries conducted in 2022. This dataset contains information from 314 libraries. Research for both of these projects is supported by the Institute for Museum and Library Services (Grant #s: MG-251839-
OMS-22; MG-80-19-0042-19; LG-250153-OLS-21).
Libraries and museums have a shared mission as sites of informal learning.
Both museums and libraries are in the process of expanding the ways they serve their communities, going beyond informal learning to become sites for convening, health and wellness, and other community needs. As their roles change, there are new opportunities for museum-library partnerships. To help children’s museums leverage their existing library partnerships (or form new ones) in support of newly emerging goals, this Trends Report offers a library centered perspective on what makes partnerships effective. What are libraries looking for in a prospective community partner? What do they value in their collaborative relationships? And what are new ways children’s museums can work with libraries to support broader community goals?
The survey also offered insights into the goals children’s museums are pursuing through collaboration. Though varying considerably, museums’ collaborative goals are connected to three broadly shared aims: (1) healing; (2) learning; (3) community. In what follows, we discuss how these findings can help children’s museums understand, approach, and evaluate collaborative work. Our hope is that sharing this information will not only stimulate dialogue around collaboration and partnership, but also help children’s museum leaders plan new collaborative programs and begin the process of building relationships with new partners.
To address these questions, we explore findings from two recent IMLS-funded field-wide surveys: (1) the Spring 2023 ACM Member Collaborations Survey (whose results we discussed in ACM Trends Report 6.3); (2) a 2022 survey conducted by Knology and the American Library Association’s Public Programs Office (ALA PPO) as part of an IMLS-funded project called “National Impact of Library Public Programs Assessment” (NILPPA.org). Both surveys included questions about collaborative programming, and their results offer insights into how libraries and children’s museums can expand and strengthen their partnerships in support of shared institutional and community goals.
Data for this report was collected through a Spring 2023 ACM member survey on collaborations. The dataset contains information from 59 member institutions. Previous pandemic-era survey data on collaborations conducted during the height of the COVID-19 pandemic supported instrument sevelopment. This research was supported by the Institute for Museum and Library Services
Children’s museums are part of an ecosystem of community services designed to enrich children’s lives through the provision of informal learning experiences. That ecosystem functions best when the various institutions comprising it are working together, sharing their resources and capabilities to more effectively connect with and serve their audiences.
We saw evidence of this during the height of the pandemic. As reported in Trends Report #4.8, #4.10, and #4.11, children’s museums adapted to the constraints imposed by COVID-19 by forging partnerships with new collaborators and expanding existing collaborations. The public health crisis inspired children’s museums to join forces with an incredibly diverse array of community organizations, including formal educational institutions and health and social service providers. These collaborations led not only to new
programs, but also to broader conceptions of community service and fresh insights into how children’s museums can deliver on their mission.
This edition of the ACM Trends series provides an update on our pandemic-era research. As of Spring 2023, 95% of children’s museums have re-opened their doors, and to understand how this transition is impacting their collaborative work, we administered a survey focused explicitly on this topic. Fifty-nine ACM members completed this survey. Their responses indicate that the resumption of in-person activities has not diminished children’s museums’ eagerness for collaborating with partners across a wide range of service vectors. Moreover, just as was true at COVID-19’s peak, programs focused on health and wellbeing remain a core part of their collaborative efforts.
The survey also offered insights into the goals children’s museums are pursuing through collaboration. Though varying considerably, museums’ collaborative goals are connected to three broadly shared aims: (1) healing; (2) learning; (3) community. In what follows, we discuss how these findings can help children’s museums understand, approach, and evaluate collaborative work. Our hope is that sharing this information will not only stimulate dialogue around collaboration and partnership, but also help children’s museum leaders plan new collaborative programs and begin the process of building relationships with new partners.
Data for this report was drawn from publicly available IRS Form 990s posted on Candid and the ProPublica nonprofit look-up tools. Supplemental data was collected through the Spring 2022 ACM member survey.
Since 2019, ACM and Knology have been working to create a data-based resource geared toward helping children’s museums learn about emerging trends across the field. The result of our efforts is the ACM Trends Data Hub—an online portal that visualizes trends in museum attendance, income, expenses, and staffing from 2016 to the present. Created with data from ACM member surveys and the publicly available US tax Form 990s that all US non-profits are required to complete every year, the Data Hub displays individual museum information that can be filtered by size, ACM member level, US region, and by city and state. As a management tool, the Data Hub allows children’s museums to monitor their performance across the aforementioned indicators, and to compare this to other institutions and sector-wide trends. Though at present the Data Hub only features US-based museums, the ACM Trends team will aim to incorporate data from museums outside the US in the future.
To facilitate the Data Hub’s use, this ACM Trends Report highlights one of its most important features: the use of median values to express sector-wide trends. Whenever highlighting sectoral averages in attendance, income, expenses, or staffing, the Data Hub uses median values. This is because medians are often preferrable to other ways of computing averages (like the statistical mean or mode) when it comes to museum data.
In this report, we explain why medians are so often the best way of identifying trends and tendencies for museums. Using examples from our research, we illustrate how museum data is often distorted by statistical outliers that make mean values less representative of the tendencies that most museums might see. This is the reason that medians offer a more accurate reflection of what a “typical” children’s museum should expect in their context.
By understanding what median values suggest, children’s museums will be better positioned to use the Data Hub to understand their financial positions, to support accountability to their funders based on industry norms in comparison to local conditions, and to assess performance compared to their peers.

| This post was originally published as ACM Trends Report 6.1, the first report in the sixth volume of ACM Trends Reports, produced in partnership between ACM and Knology. |
Members are the lifeblood of many children’s museums. They are loyal patrons who trust museums to provide playful learning opportunities for their children, often complementing trips to the zoo or aquarium. But when children “age out,” families may turn to other cultural institutions and start to reconsider the value of their membership. Understanding value seekers’ calculations can help children’s museums cultivate trust through transparency.
In this Trends report, we look at what membership pricing and attendance data can tell us about children’s museums. We focus on what museums might want to think about when attempting to stabilize their membership base, and on how to forge trusting relationships with prospective members.
National data related to membership pricing has been of particular interest to the ACM leadership community in recent years, especially as it relates to post-pandemic operations. Prompted by a specific request from an ACM member, this report contributes to these ongoing discussions. We used data from the Spring 2022 targeted ACM member survey and collected additional information from member museum websites. We developed a dataset from 90 children’s museums to see if there were differences in membership costs between small, medium, and large museums. We also compared admission prices across these categories and calculated a “pay less” point—that is, the number of times a family of four would need to visit in order to make the
purchase of an annual membership a cost-saving act.
Our analysis yielded two main findings. First, even though admission prices and membership costs are highest for large museums, the number of single visits needed by a family of four to “pay less” is lower for these museums than it is for their small and medium-sized counterparts. Second, we confirmed that admission prices and membership costs tend to rise in parallel, which means that even though base admission prices may be determined based on local cost of living concerns, ACM members can still compare their rates to other children’s museums, Taken together, these findings can help children’s museums determine how to align pricing decisions with the needs and interests of value-seeking visitors—that is, those who purchase memberships based on a calculation of savings.
In Spring 2022, the ACM Trends Team circulated a survey to ACM member institutions requesting data on attendance, admission prices, membership costs, and other operations. After supplementing this data with information gleaned from member websites in August 2022, we assembled a dataset of 90 museums (30 of each size). We summarize the data in Table 1 below.
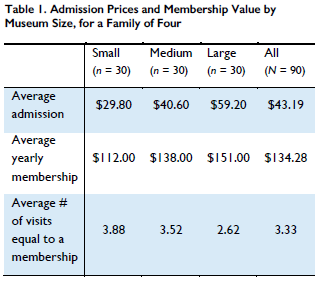
Table 1 compares admission and membership prices for a family of four at small, medium, and large museums. Admission prices are based on the general admission price for adults and children. When prices for adults and children were different, a family of four was calculated with two adults and two children.
We calculated these figures for a two-adult, two-child family on account of current US Census data (which shows that the average US family contains 3.13 people), and because this aligns with demographic research showing that a plurality of mothers in the US today report having two children (Pew Research Center, 2015).
The bottom row in Table 1 presents the average number of times a family of four would need to pay admission before achieving cost-savings through a membership purchase. The fourth column illustrates the mean cost across all size categories—which is an appropriate way to calculate averages in a dataset like this one, as it contains few outliers.
Clearly, the larger the museum, the higher the membership and admission costs for a family of four. Nevertheless, the number of visits needed for a valueseeker to “pay less” for multiple visits through a membership is lower (2.62) for large museums than for their small (3.88) and medium-sized (3.52) counterparts.
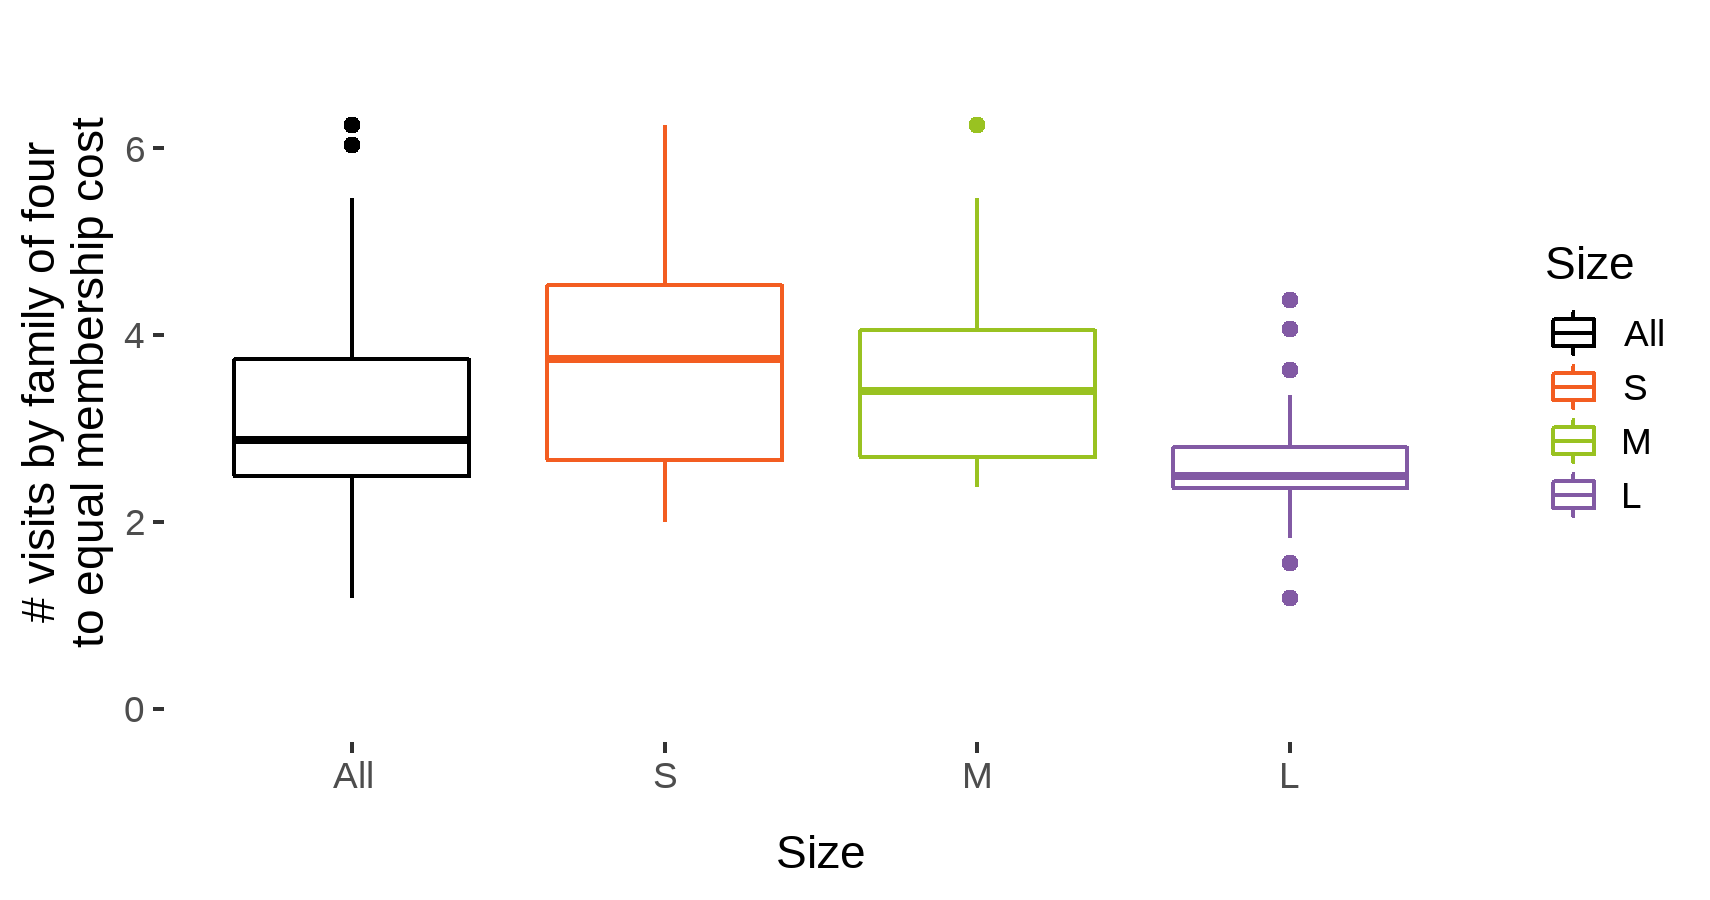
Figure 1 presents data from the bottom row of Table 1 as a “box and whiskers” plot. To create this, we “normalized” pricing data to show membership costs (for a family of four) as a multiple of admission costs for each children’s museum. The “box” part of the plot illustrates the middle half of the data (in other words, where 15 of the 30 museums in each size category sit), while the “whiskers” indicate those museums where prices are higher or lower than their peers.
When a museum stands alone compared to others, the box and whiskers plot expresses this with dots, considered outliers. When multiple museums lie in the same range, this is indicated by a line placed above the box. The line in the middle of the box illustrates the median, or the exact middle of all of the data in that category. We can see from those lines that medium-sized and small museums tend to be near one another. To see how many visits a family of four would need to make before generating savings through the purchase of a membership, look at the Y-axis, which plots the ratio of membership costs to visit price. This data can be used as a foundation for making decisions about membership pricing, especially in connection with data on premiums.
We also collected data on additional benefits provided with museum memberships—for example, discounts for rentals or birthday parties (n = 60), member-only events (n = 53), and reciprocal admission to other ACM (n = 24) or ASTC (n = 13) member institutions. Most museums offer these in some form; 8 out of 10 small museums, 9 out of 10 medium-sized museums, and all large museums indicated additional membership benefits. The total number of additional benefits did not appear to be related to a higher value of memberships.
One benefit, however, did have a significant effect on “trips to match cost.” Offering a discount on space rentals, after accounting for museum size, was related to higher membership costs. Though some have suggested that early access or discounts on summer camps are perceived as an incentive for families who can afford summer camp experiences, our analysis did not provide any evidence that the benefit is related to higher or lower membership prices.
We also looked at a subset of the data from fifty-one museums (1 small, 15 medium-sized, 20 large, and 3 yet to be classified) who responded to the Spring 2022 ACM member survey and provided information on annual attendance and member attendance from FY2016 to FY2021. Looking at the data, we can determine historical trends in museum attendance, and also calculate the proportion of overall attendance consisting of museum members.
Prior to the pandemic, in FY2016 through FY2019, the median number of memberships purchased per year for these museums was between 2200 and 3000. In FY2020 and FY2021, this value dropped to 968 & 1188 memberships purchased, respectively. Along with this decline, the proportion of overall visitors who were
museum members decreased roughly 6% in 2021 for these museums. While these museums are just a portion of the overall ACM field, the decline likely reflects the impact of the pandemic across the sector.
People purchase museum memberships for different reasons. These purchases provide a reason for frequent visits—which not only benefits children but can also help museum leaders advocate for children’s access to the healthy spaces of learning and discovery children’s museums provide. For some, a membership is a valueseeking purchase, one made through a consideration of future costs, benefits, and savings. Value-seekers become members because they want museum-going to be a regular part of their children’s lives. These pricing data tell us that museums anticipate four visits a year by their value-seeking members, setting prices that justify at least four or more visits in a membership year.
For others, purchasing a membership may not be driven by monetary concerns. They may simply want to invest in an institution that is doing good work, or to support a local institution that is good for children. Some individuals may purchase memberships to build social capital, because they want to support an organization whose values they identify with, and because they want their membership to reflect something about who they are. They may also become members because they want to encourage their grandchildren, nephews, nieces, or other relatives to visit them, or because they want to provide gifts to families with children. These “affinity members” may also care less about free admission than about membership perks, premiums, or about symbolic value—for example, discounts on birthdays or group tours, reciprocal admission at other ACM member museums or other cultural institutions, access to priority registration, exclusive programs, or behind-the-scenes content.
In other words, value is a complex, multidimensional thing. When thinking about those who see the primary value of a museum as its price, children’s museum leaders can also consider how decisions related to pricing might impact the perceived trustworthiness of their institutions. As ACM Trends #5.3 discussed, in order to cultivate public trust, museums need to demonstrate competence, reliability, sincerity, integrity, and benevolence. During the height of the pandemic, many museums demonstrated benevolence through refunds or by pro-rating existing memberships. At present, some museums are considering increased fees to recoup pandemic-related monetary losses. Doing so may risk the trust built through the pandemic, especially as cost-of-living increases may make more members value-seekers.
Data for this report was collected through: (1) an online survey distributed by ACM in April 2022; (2) a review of ACM member institutions’ websites. This dataset contains information from 90 current ACM member museums.
Our analysis used the size categories developed in ACM Trends Reports #1.1 and #1.7. We use these categories because institutional size predicts a range of outcomes for children’s museums. We note that museums offer many types of reduced priced tickets or free admission, and some unique premiums that were not used in this analysis.
Voiklis, J. (2022). Key Concepts: Trust. ACM Trends 5(3). Livingston, G. (2015). “Childlessness Falls, Family Size Grows Among Highly Education Women.” Pew Research Center.
US Census Bureau (2021). America’s Families and Living Arrangements. Retrieved from: [https://www.statista.com/statistics/183657/average-sizeof-
a-family-in-the-us/]
This project was made possible in part by the Institute of Museum and Library Services. The views, findings, conclusions or recommendations expressed in this publication do not necessarily represent those of the Institute of Museum and Library Services.
The Associations of Children’s Museums (ACM) champions children’s museums worldwide. Follow ACM on Twitter, Facebook, and Instagram. Knology produces practical social science for a better world. Follow Knology on Twitter.
| This post was originally published as ACM Trends Report 5.4, the fourth report in the fifth volume of ACM Trends Reports, produced in partnership between ACM and Knology. |
For this ACM Trends Report, we invited staff from National Children’s Museum in Washington, DC, to write about their experiences with virtual programming during COVID-19. Staff from the museum participated in the October 2021 discussion forum focused on virtual programming (See ACM Trends Report 5.1 for details).
After seventeen years without a permanent home in Washington, DC, National Children’s Museum (NCM) reopened as a science, technology, engineering, arts, and math (STEAM) focused institution on February 24, 2020. Eighteen days later, the Museum temporarily closed as a precaution against COVID-19, and committed to providing families and educators with free, meaningful experiences at home. When the institution reopened, NCM continued to offer virtual programming for children under twelve and their families, garnering more than three million impressions to date.
While preparing to reopen, NCM conducted a survey to better understand the community’s engagement with the museum, including its virtual offerings. Fifty percent of respondents indicated they would be likely or very likely to engage with virtual offerings once NCM opened. Although the virtual offerings were initially developed in response to a need created by the pandemic, they are now part of the museum’s ongoing programmatic strategy.
This ACM Trends Report describes the survey items related to virtual programs and the current “evergreen” programming that will be retained based on these data.
When NCM reopened to in-person visits in September 2021, it began complementing its on-site programming with the on-demand resources developed during the pandemic. As NCM looks to the future, staff are committed to maintaining, and in some cases, expanding the museum’s virtual offerings. All of the virtual experiences created during NCM’s pandemic closure are fully aligned with its mission and continue to be essential to its ability to promote its mission to audiences locally and abroad.
Between March and May 2020, NCM produced free STEAM videos that premiered seven days a week on its social platforms (Facebook, Instagram, Twitter). Funded by Booz Allen Hamilton, the series called “STEAMwork” featured experiments, projects, design + build challenges, story times, and demonstrations.
These videos and accompanying resources were made available free-of-charge on NCM’s website and continue to be featured as “STEAM At Home” opportunities in the museum’s newsletter. Staff also send the videos to educators as a post field trip resource for continued learning.
One NCM exhibit that was successfully adapted is its Climate Action Headquarters. In the pre-pandemic era visitors had participated in monthly missions and climate challenges. The virtual format introduced during the pandemic allowed visitors to determine their own climate action hero persona by answering a playful online quiz. This virtual version is available as part of NCM’s STEAMwork series. At this writing, NCM staff anticipate producing additional STEAMwork videos and related resources with ties to curriculum standards to promote classroom use.
With funding from GEICO and The Akamai Foundation, NCM launched the STEAM Daydream with National Children’s Museum podcast in June 2020 to provide tailored content to young audiences.
Staff engaged 3rd– to 5th-graders as interviewers. The first season had 18 episodes on critical, timely issues. Each episode allowed young learners to hear from STEAM experts, ask questions, and understand the world around them. Topics included:
• What children want to know about the COVID-19 vaccine with Dr. Roberta DeBiasi, the Chief of Infectious Diseases at Children’s National Hospital in Washington, DC,
• The wonder of animation with Dave Cunningham, Supervising Director of Nickelodeon’s SpongeBob SquarePants.
The Museum’s podcast, featured in The New York Times, The Washington Post, and Vox, was streamed 5,000+ times, with 15% international listenership for the first season. In 2022, NCM began production for the second season of the podcast for debut in the fall, followed by an assessment to determine the feasibility of a third season.
NCM also developed two 20-minute virtual field trip videos based on in-person offerings. These virtual trips were offered to educators and families free of charge. Both virtual field trips are aligned with Common Core State Standards and Next Generation Science Standards. So far, the videos have been requested by thousands of educators across all 50 states.
The first video, “Head in the Clouds,” prompts budding young scientists to observe and identify different types of clouds. When this video was released in May 2020, the museum received 475 initial requests for it from educators and caregivers. Of those 475 requests, 285 were from educators, who almost universally expressed interest in having their class participate in virtual extension sessions related to the video.
This demand enabled the museum to secure funding from a media company to develop a second video, “Climate Action Heroes.” This video explored the difference between weather and climate and introduces learners to seven real-life climate action heroes from across the country.
To extend learning beyond the videos, NCM has offered classroom teachers the opportunity to sign up for “live virtual extension sessions’’ with museum educators. These hour-long sessions, held over platforms like Zoom and Microsoft Teams, help youth in formal classroom settings delve deeper into complementary content, participate in virtual activities, and ask museum educators questions.
Grant-funding through the end of 2021 offset the fee-based model for local Title 1 schools to book the sessions at no cost. Between May 2020 and June 2021, NCM fielded requests from 1,401 educators interested in live classroom sessions. Overall, NCM received 2,382 overall requests for access to the “Head in the Clouds” and “Climate Action Heroes” videos.
At this writing, staff plan to focus on content designed specifically for 3rd to 5th grade, which make up the majority of onsite field trips at the museum. Staff believe that this audience will be best served through live virtual field trips led by museum educators.
Based on the scale of these programs, NCM added a dedicated second full time educator to focus on teaching live extension sessions. The internal analysis also confirmed the museum will require dedicated space for a virtual field trip studio to allow educators the privacy and technical setup to teach effectively.
Lastly, the team recognized that programming developed during COVID tended to be longer than newer audiences anticipate. They concluded that offering shorter, fee-based classes, as well as promoting live virtual field trips to a national audience may be an effective use of resources.
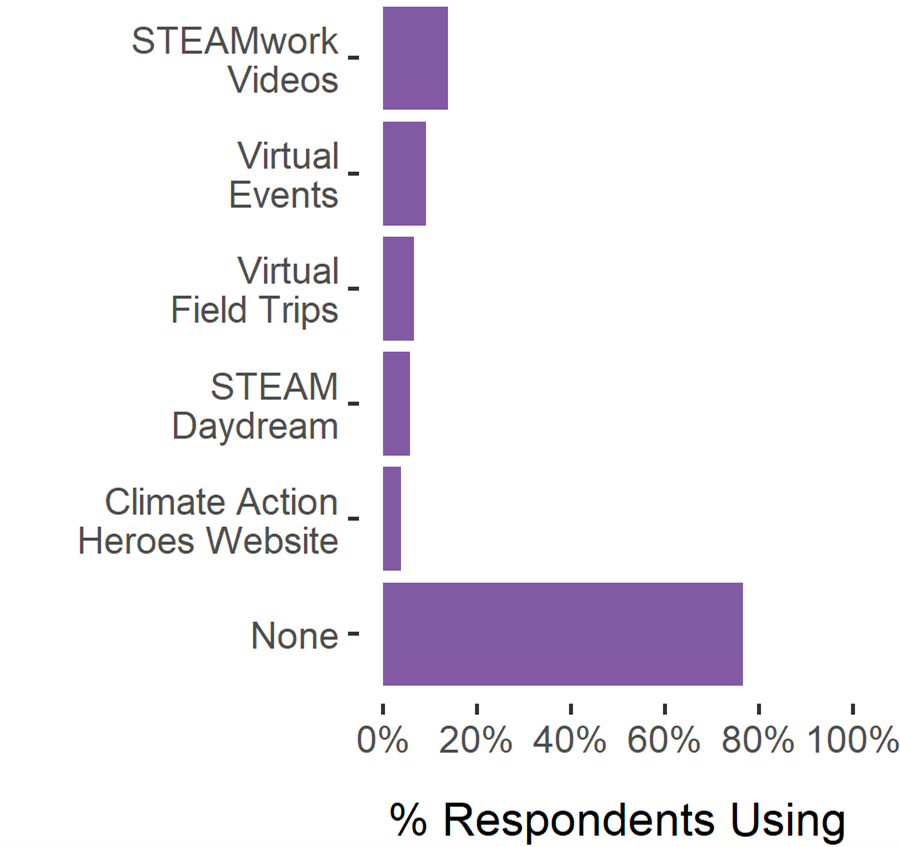
Figure 1. Responses to NCM’s re-opening survey question on digital offerings used (N = 316).
NCM shared a re-opening survey through their newsletter, which had nearly 10,000 subscribers at the time of distribution. The 316 returned surveys translate to a (roughly) 3% response rate.
The survey asked two questions on virtual programming:
• During National Children’s Museum’s temporary in-person closure, did you use any of the museum’s digital offerings? If so, please check all that apply.
• How likely are you to continue to use–or begin to use–the museum’s digital offerings once our institution and others are open for in-person visits?
While only 15 percent or less of respondents utilized the museum’s digital offerings (Figure 1), 24 percent said (Figure 2) they would be likely or very likely to use digital offerings in the future. An additional 24 percent indicated they were neutral to digital programming.
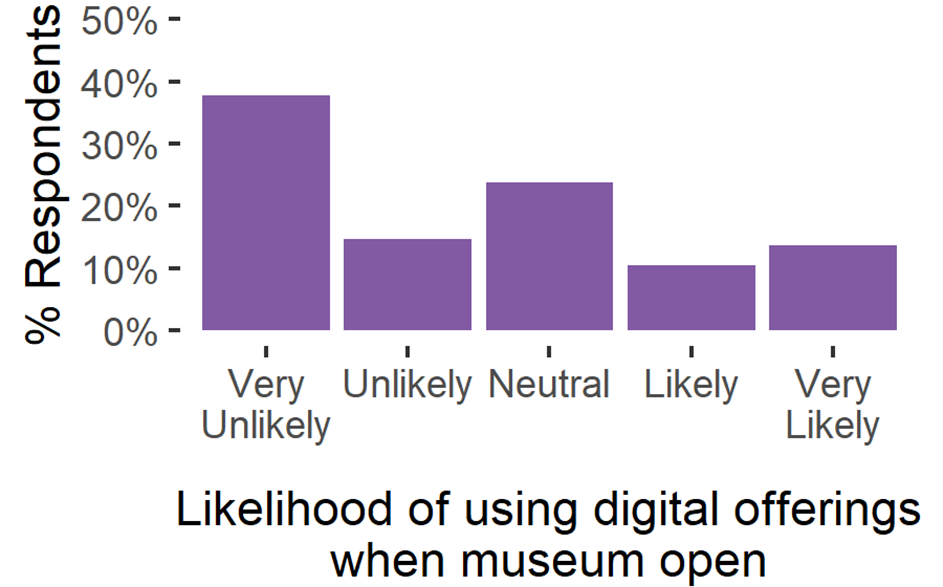
Figure 2. Responses to NCM’s re-opening survey question on digital offerings (N = 316).
With roughly 50% of respondents neutral or likely to consider virtual offerings once NCM re-opened, the Museum felt there was sufficient interest to continue some types of virtual programs, especially given prevailing health and safety concerns. Coupled with the data on educators’ interest in virtual field trips and live educator extension sessions, NCM felt compelled to retain virtual programming as an asset for the museum moving forward.
There are a few important takeaways from the NCM’s experiences with virtual programming:
• NCM’s reach across the country has expanded through free virtual content, contributing to its identity as a national institution. For example, as of September 2021, the Museum has served educators in all 50 states, which is a 90% increase from February 2020.
• Creating new categories of experiences and content has strengthened a culture of innovation amongst staff members, providing the opportunity to think creatively and develop new skillsets.
• Balancing the allocation of resources, especially staff time, between designing and implementing onsite programming and keeping this digital exhibit dynamic with fresh content is highly challenging. Virtual content creation is extremely labor and time intensive, as well as requiring additional investment in equipment and even reallocation of physical space.
• The content available to the public on demand via social media or podcast platforms is free. This has depended on continued success in corporate fundraising.
• By demonstrating its ability to adapt and fulfill the NCM mission in a new environment, the organization was able to tap new funding sources. This extends beyond grants to support content creation; our experience suggests is an opportunity to generate revenue on an ongoing basis from fee-based live virtual trips for primary school classrooms nationwide.
• NCM’s profile has been raised by the significant attention its high-quality virtual programming has received in national media coverage.
• Public engagement plays a key role in sustaining virtual programming, especially in terms of justifying the allocation of labor. A reduction in online consumption would affect the ability to create new content.
Association of Children’s Museums. (2021, March 18) Reflecting on One Year of the Pandemic for Children’s Museums and the Communities They Serve. https://bit.ly/3jhxmJF
Flinner, K., Field, S., Voiklis, J., Thomas, U.G., & ACM Staff (2021). Museums in a Pandemic: Personnel & Rebuilding Teams. ACM Trends 4(12). Knology & Association of Children’s Museums.
This project was made possible in part by the Institute of Museum and Library Services. The views, findings, conclusions or recommendations expressed in this publication do not necessarily represent those of the Institute of Museum and Library Services.
The Associations of Children’s Museums (ACM) champions children’s museums worldwide. Follow ACM on Twitter, Facebook, and Instagram. Knology produces practical social science for a better world. Follow Knology on Twitter.
| This post was originally published as ACM Trends Report 5.2, the second report in the fifth volume of ACM Trends Reports, produced in partnership between ACM and Knology. |
For this ACM Trends Report, we invited Scott Burg from Rockman et al to write about his team’s research during the pandemic around parents and caregivers’ preferences for virtual programming by children’s museums. Scott was a speaker at a discussion forum with ACM members focused on virtual programming in October 2021 (See ACM Trends Report 5.1 for details).
Due to the start of the COVID-19 pandemic in March 2020, museums had to make critical decisions about conditions for opening and closing as well as virtual programming based on limited evidence. This shift left children with limited options to engage socially with peers and an increased reliance on parents and caregivers to manage school activities and after-school opportunities. One outcome of the pandemic was an increase in online museum offerings, many of which were targeted at children.
Most museum studies during the pandemic focused on health and safety concerns and returning visits (e.g., mask wearing, social distancing, capacity levels, etc.). This report focuses on results of a study of the potential value of continuing to offer virtual learning activities following the physical reopening of museums. Researchers at Rockman et al (REA) wanted to learn what parents and caregivers felt about children’s museums’ virtual programming, and the types of virtual programs that children’s museums could develop to address families’ needs, interests, and concerns.
In the fall of 2020, REA collaborated with the Children’s Creativity Museum in San Francisco to survey northern California Bay Area children’s museums. The survey collected parent and caregiver feedback on the types of virtual programs they would like to see for their children. Following the first wave of data collection and validation of the instruments, a second wave expanded the research opportunity to other institutions in the Association of Children’s Museums (ACM) network (https://bit.ly/REA-ACM_Blog). In total, 13 different children’s museums across the country distributed the survey to their members and mailing lists.
The REA study focused on understanding the types of virtual programming that parents and caregivers want from children’s museums. Their preferences for types of virtual programs might be influenced by a child’s school or care situations, child age, amount of screen time, cost, and other factors. Each participating museum received real- time access to aggregate study findings as well as their own museum’s individual data through customized digital reports.
Between November 2020 and January 2021, REA gathered more than 1,200 responses from museum patrons. Not all survey respondents answered every question. The bulk of respondents were parents or caregivers of children aged 2-7 (Figure 1). School and care situations varied among participants’ children, spanning those attending school or daycare in person; and those attending virtually either in a hybrid solution (in-person and remote) or being homeschooled or cared for at home (Figure 1).
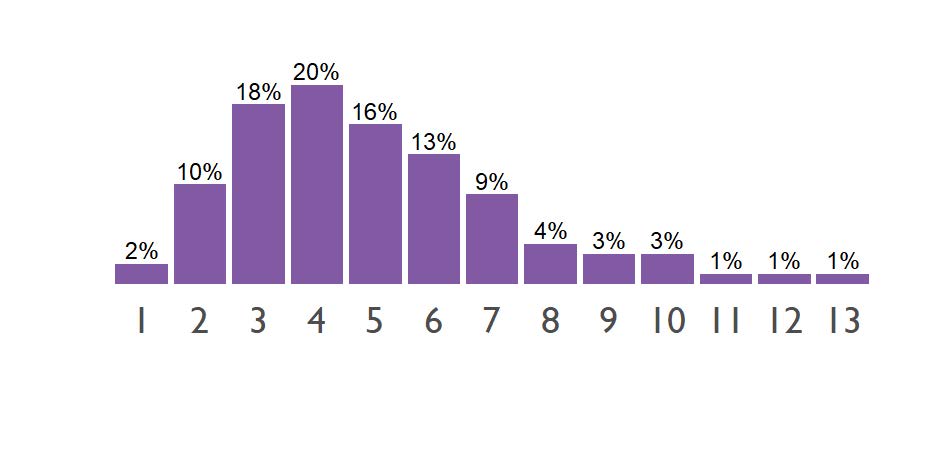
Figure 1. Percentage of Respondents by Child’s Age (n = 941)
We found that parents and caregivers’ interest in virtual programs was mixed. About half of all respondents said they had “no interest” or “slight interest” in virtual programs. The other half expressed “moderate” or “high” interest (Figure 2). One overriding concern for participants was the amount of screen time their children were already exposed to. One in five respondents reported that their child spent more than three hours each day on a computer or digital device. Surprisingly, more screen time did not coincide with less interest in virtual programs. These findings suggest that everyone’s threshold for screen fatigue is different.
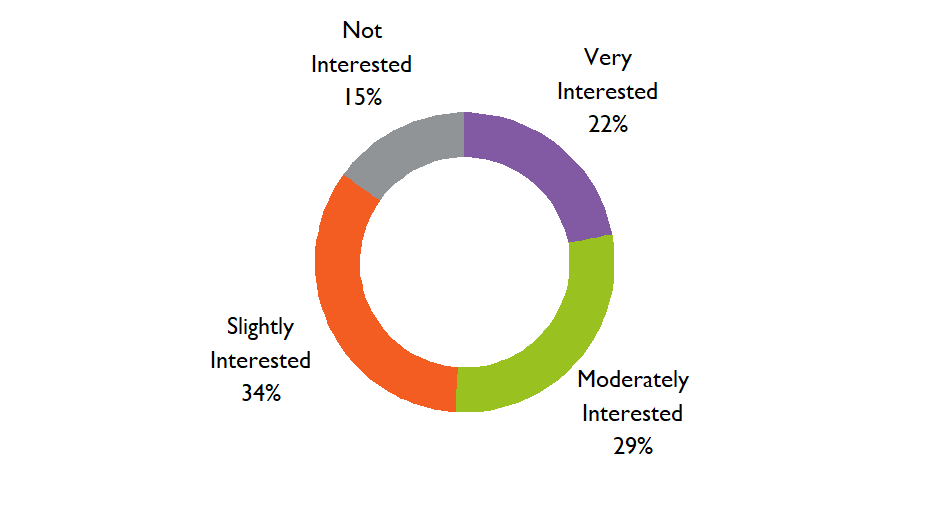
Figure 2. Percentage of Respondents by Interest Level (n = 945)
Our survey showed a correlation between parents and caregivers’ interest in virtual programs, and the type of schooling or care their child was receiving at the time of the survey. Parents and caregivers of children who attended school or daycare in-person were less interested in virtual programs than those whose children were being home-schooled, attended school online or were in a hybrid situation (Figure 3). A child’s age was not related to their parent or caregiver’s interest in virtual programming, suggesting that these issues are based on values rather than a common consensus on developmental concerns.
Despite concerns about screen time, the survey results showed that many parents and caregivers wanted to reconnect with their local children’s museum. They also wanted to replicate museum experiences either at home or in a remote environment.
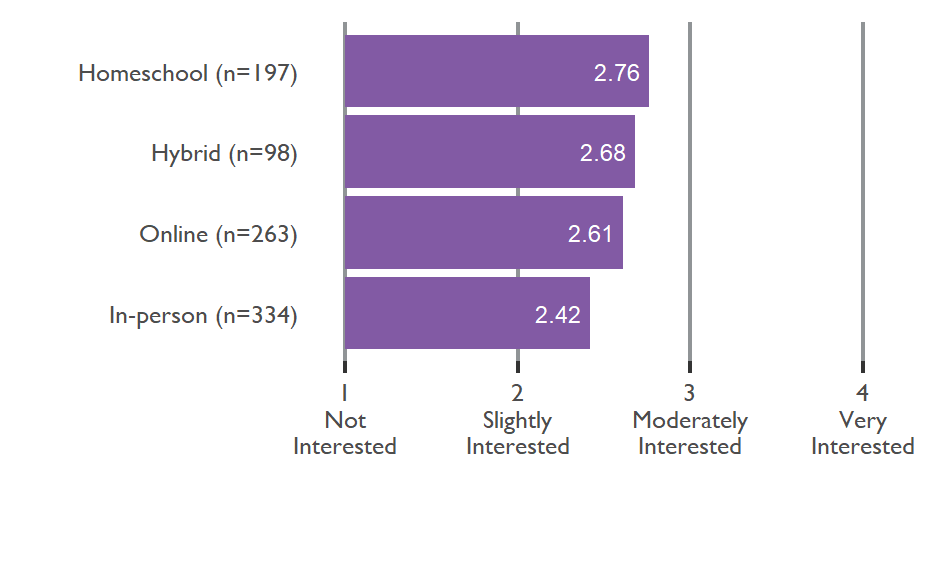
Figure 3. Parent & Caregivers’ Interest in Virtual Programming by Schooling Type
Parents and caregivers prioritized museum approaches in both virtual and in-person settings that:
Parents and caregivers also indicated an interest in programs that offered the kinds of experiential learning that children’s museums succeed at. These included programs that actively engage participants (e.g., science, art) vs. activities that are more passive (e.g., read alouds, learning study skills). Parent and caregivers were not interested in activities that duplicated virtual school lessons. Nearly three-fifths of respondents said they would consider paying for virtual programming.
Most parents and caregivers preferred virtual programming scheduled on weekends. They indicated a slight preference for weekday virtual programming that allows independent child participation (Figure 4).
The survey did not reflect the many opportunities for children’s museums to educate parents and caregivers on methods to regulate and participate with their child’s virtual learning activities. Research suggests that when parents and caregivers participate and scaffold their children’s activities (asking questions, extending play), this results in higher retained learning (Takeuchi and Stevens, 2011).
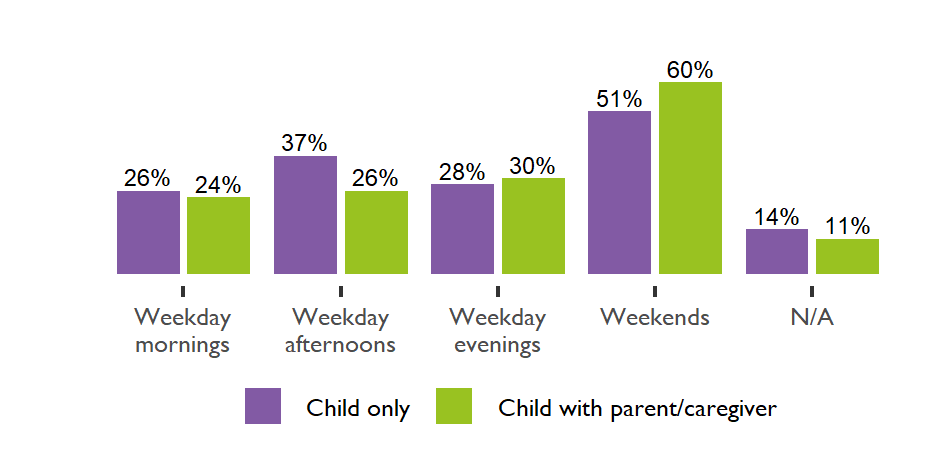
Figure 4. Parents & Caregivers’ Interest in Virtual Programming by Time and Day
Anxiety over prolonged screen time can undermine this type of support. What it means to be an effective ‘digital parent’ can be perceived as contradictory, as parents and caregivers try to minimize the negatives of screen time while benefitting from the affordances of the technology.
Parents and caregivers need support to better understand the content of what their children watch and do on screens, the context of where they watch and do, and the connections they make (or do not make) while watching and doing (Livingstone et al, 2017).
This integrated approach provides more insights into the positive or negative impact of digital media use than a simple measure of time. Parents and caregivers need to be encouraged to think critically about how to support positive uses and minimize negative consequences. This is where children’s museums can play a valuable role.
As the pandemic restrictions are lifted, the needs and expectations of museum audiences will evolve. This survey provided insights into the minds of audiences during the fall and winter of 2020, and but cannot predict what else may change as schools and museums continue to reopen. These data provide some insights that can support analysis and monitoring of how virtual programming is valued in the future.
To put these findings to work, virtual programming offered by children’s museums can respond to these key takeaways:
Are parents and caregivers tired of virtual programs, or has remote learning become a mainstay of education? Is virtual programming enabling visitors to form a new kind of relationship with children’s museums? Can museums use virtual programs to extend their reach to underserved audiences, increase access to diverse communities, or add value to their institutions as trusted sources of information and learning? Where could collaboration between children’s museums or between museums and school districts strengthen both the informal and formal education landscape? What role can researchers and evaluators play in facilitating this discussion?
To answer those questions and build on this study of virtual programming that parents and caregivers want from children’s museums, the researchers hope to expand the number of institutions involved in any future studies to ensure the data are representative and determine if regional variation or museum size influence perceptions. Ideally, future research will recruit a more inclusive sample of community participants including parents and caregivers who may not visit children’s museums regularly or do not have access to virtual programming.
We also hope to encourage the development of research- practice partnerships, which can serve as a critical tool for generating actionable data that children’s museums need to navigate the post-COVID world
Field, S., Fraser, J., Thomas, U.G., Voiklis, J., & ACM Staff (2022). The Expanding Role of Virtual Programming in Children’s Museums. ACM Trends 5(1). Knology & Association of Children’s Museums.
Takeuchi, L., & Stevens, R. (2011). The new coviewing: Designing for learning through joint media engagement. New York: The Joan Ganz Cooney Center at Sesame Workshop.
Livingstone, S., Lemish, D., Lim, S. S., Bulger, M., Cabello, P., Claro, M., Cabello-Hutt, T., Khalil, J., Kumpulainen, K., Nayar, U. S., Nayar, P., Park, J., Tan, M. M., Prinsloo, J., & Wei, B. (2017). Global Perspectives on Children’s Digital Opportunities: An Emerging Research and Policy Agenda. Pediatrics, 140(Suppl 2), S137–S141.
This project was made possible in part by the Institute of Museum and Library Services. The views, findings, conclusions or recommendations expressed in this publication do not necessarily represent those of the Institute of Museum and Library Services.
The Associations of Children’s Museums (ACM) champions children’s museums worldwide. Follow ACM on Twitter, Facebook, and Instagram. Knology produces practical social science for a better world. Follow Knology on Twitter.
| This post was originally published as ACM Trends Report 5.1, the first report in the fifth volume of ACM Trends Reports, produced in partnership between ACM and Knology. |
Volume 4 of the ACM Trends Report series, Museums in a Pandemic, reported findings from regularly conducted surveys by Knology and Association of Children’s Museums (ACM) about the impact of the COVID-19 pandemic on the children’s museum field. Museums closed their doors to the public in March 2020 at the start of the pandemic. More than 70% of ACM member museums were offering virtual programming by June 2020. Last year, museums slowly began reopening for in-person visits and had reached 61% by March 2021. The Spring 2021 ACM COVID impact survey suggested that about two-thirds of museums (n = 43 out of 67) were interested in continuing to offer virtual programming or engaging with communities online even after pandemic restrictions lifted.
In October 2021, Knology and ACM launched the first in an annual series of discussion forums that aim to address emerging questions from the field. Each forum features a panel of external experts that share recent research that might be applicable to the work of children’s museum operations. Presentations are followed by breakout sessions where museum professionals can consider the implications of that research to their practice, and explore their perspectives on the theme more broadly.
Based on the results of the impact survey, this first discussion forum focused on virtual programming. It is important to note that by October 2021, when the discussion forum took place, 91% of ACM members had reopened for in-person activities. We invited leaders and educators from ACM members to share their perspective about virtual programming. A total of 39 leaders and educators from museums across the United States attended the discussion forum. They represented museums that had offered virtual programming during the pandemic, and museums that had not done so. For this conversation, we defined virtual or online programming as programming or exhibits that require at-home or on-the-go screen time. This definition of virtual programming included activity kits if they offered a virtual or online engagement component.
For the October 2021 discussion forum, we invited four experts to present their research. ACM Trends Report 5.1 focuses on the discussions that followed those presentations. During those conversations, the attendees explored the role of virtual programming as part of their institutional missions and culture, as well as their impact assessments of that programming.
The forum discussions included meeting attendee polling, and a Strengths, Weaknesses, Opportunities and Threats (SWOT) exercise with attendees based on their own experiences and institutions. This was followed by a general discussion about the future of virtual programming and possible needs to make that vision a reality.
We conducted live polling during the discussion forum, which helped to benchmark attendees’ opinions to support the discussion. These polls are not considered representative of the entire field. Rather, they represent the attendees’ perspectives.
Most attendees reported that they had either expanded or started virtual programming in response to the COVID-19 pandemic (n = 21). A little over half said that they planned to continue offering virtual programming in future (n = 16). We also asked museums to select the types of virtual programming they have done from a list generated from data gathered from the Spring 2021 COVID impact survey. The most common offering was take-home activity kits that included a live or pre-recorded virtual activity led by museum staff. This was followed by a virtual story time, and other pre-recorded and live videos on social media. Other activities that museums provided included free-play prompts, interactive games, and virtual museum tours.
The SWOT exercise aimed to better understand museums’ experiences with and perceptions of virtual programming. We asked all attendees to participate whether they offered virtual programming or not so that we could get a mix of perspectives.
During the pandemic, many museum educators were tasked with filming virtual education programming for their institutions. As a result, museums invested in infrastructure and systems their staff needed to create and deliver these programs. This allowed museums to build up a library of virtual resources that they can provide to different audiences and share with other institutions. For example, one attendee said that, after participating in the museum’s virtual education programming, some parents of homeschooled children were interested in in-person learning experiences with their children at the museum.
Virtual programming has had other benefits for children’s museums, including increased accessibility. Many respondents said it helped make their programming more accessible to families. Some respondents also shared that the pandemic was an opportunity for their staff to develop new skills in support of virtual programming.
Lastly, many respondents said that working on virtual programming helped them strengthen existing partnerships, particularly with schools and educators. For example, one museum developed a website that showcases content from their exhibits, which they shared with local educators.
The limits of virtual programming meant the museums had to think creatively about how to engage with families in their communities. Feedback from museum staff and leadership indicated that some felt that switching to virtual programming took away many of the elements of play they curated for their in-person visitors. Some respondents indicated they struggled with creating programming because virtual learning pedagogy was unknown or unfamiliar to them. Museums also had to consider the trade-offs and benefits to children’s learning between pre-recorded and live virtual sessions.
Museum staff described challenges with developing the skills needed to provide virtual programming. Some staff described difficulties with forming connections online audiences. Not all museum educators were comfortable with presenting content in an online format. Because of these experiences, some museum staff wanted resources about best practices for providing programming in virtual environments.
Museums either released or furloughed on average between 40 – 55% of their staff (ACM Trends Report 4.12). We heard from several participants that as a result they lacked the time and resources to produce high quality virtual programming. Some museums chose not to produce any virtual programming. Also, a few museums charged a fee, which may have prevented some families from accessing their programming.
Several attendees said they needed resources to help them continue providing virtual programming. One suggestion was to develop a platform where museums can exchange curriculum, media assets, and other resources related to providing effective virtual programming. Some museums have already taken steps to begin sharing resources. For example, one attendee said their institution was working with a consortium of other museums in California to collaboratively develop five activity kits that include video components they would share equally as a resource. By pooling their resources and working collaboratively on the content, these museums created higher quality kits and videos for their communities, while limiting costs and burdens on museum resources.
Some museums described opportunities for continuing virtual programming in partnership with local schools. These partnerships help extend the museum experience beyond in-person interactions to include learning in other contexts. One museum, which created a website with lesson plans for educators during the pandemic, now works with the local teachers. They are now developing targeted field trips that have a classroom component and an in-person or virtual experience.
The primary threats to continuing virtual programming in children’s museums are time, energy, and return on investment given the variability in attendance. Creating virtual programming can be a strain on both staff capacity and museum resources. One museum leader said they would need to staff a department dedicated to virtual programming to continue providing this type of service. Another museum leader said their pandemic virtual programming was necessary, but likely beyond their means when the museum returned to full operations due to staffing and budget constraints.
Many attendees felt that the return on investment was not sufficient for staff to continue virtual programming at their institutions. Concerns included the lower revenue from virtual programming when compared to live in- person programming. A few mentioned they were redirecting resources from virtual programming back toward reopening activities. One attendee said their museum’s partnership with Amazon Affiliates had helped to reduce their spending on virtual programming and enabled them to provide free or low-cost activity kits to families. But most leaders said that continuing to provide this kind of programming may not be sustainable without additional sources of funding.
Another critical concern raised in this session was Zoom Fatigue, the sense that interacting on screens had become overwhelming for working families and school age children. Attendees observed that many parents and caregivers who were responsible for supporting their families and helping their children with formal online learning seemed less inclined to engage in additional virtual learning with museums.
During the pandemic, museums reimagined their operations and service, and this has affected the staff. As COVID-19 restrictions are lifted, many museums have re- opened their doors to in-person visits. As of March 2022, 92% of ACM members globally are open the public (up from 91% when the discussion forum took place in October 2021). This has implications for the future of virtual programming in children’s museums. Museum staff shared their perspectives based on their experiences during the pandemic, and their thoughts on continuing to provide online content in future.
Museum staff said that virtual programming offered during the pandemic was most successful when it was done in partnership with local schools and educators. They also said that partnership was the most sustainable way to continue offering virtual programming in future. However, they noted that there was a lot less demand for virtual programming now that children’s museums and schools have re-opened for in-person activities.
Most attendees reported that they were re-assigning staff and resources from virtual programming back to their traditional in-person activities. Several mentioned the limited staff time available to keep offering virtual programming, even though they felt it was valuable extension of services. Some children’s museum staff reported developing a backlog of virtual content they could roll out slowly over time, but most had no plans to develop new virtual content once full operations resume.
Overall, attendees were reluctant to continue with virtual programming without financial sponsorship. They reported that the funding for virtual programming during COVID-19 restrictions came from grants, but even that was relatively minimal. They suggested that hiring additional staff who would be responsible for fundraising, planning and executing virtual programming might allow these programs to continue.
There are a few important takeaways from the responses to the polling questions and the outcomes of the SWOT exercise:
and
Flinner, K., Field, S., Voiklis, J., Thomas, U.G., & ACM Staff (2021). Museums in a Pandemic: Personnel & Rebuilding Teams. ACM Trends 4(12). Knology & Association of Children’s Museums.
Association of Children’s Museums. (2021, March 18) Reflecting on One Year of the Pandemic for Children’s Museums and the Communities They Serve. https://bit.ly/3jhxmJF
This project was made possible in part by the Institute of Museum and Library Services. The views, findings, conclusions or recommendations expressed in this publication do not necessarily represent those of the Institute of Museum and Library Services.
The Associations of Children’s Museums (ACM) champions children’s museums worldwide. Follow ACM on Twitter, Facebook, and Instagram. Knology produces practical social science for a better world. Follow Knology on Twitter.
| This post was originally published as ACM Trends Report 4.14, the final report in the fourth volume of ACM Trends Reports, produced in partnership between ACM and Knology. |
This is the final report in the Museums in a Pandemic volume of the ACM Trends Report series. Since March 2020, the ACM Trends Report team has tracked the impacts of the pandemic on children’s museums through surveys, conversations, and other data collected by ACM. This ACM Trends Report presents data from museums that responded to our Spring 2021 survey.
Throughout the pandemic, we collected data on children’s museum operations and what was vital to their survival. We benchmarked this information against 2018 fiscal year 990 data. We used these data because 2018 represents the last pre-pandemic fiscal year for all of the organizations in our sample set. This comparison helped us understand the pandemic’s impact on museum operations.
As the pandemic continued into 2021, children’s museums were balancing re- opening to the public with the continued need to focus on securing necessary funding to keep operations going. We documented ACM members’ fundraising efforts in the early stages of the pandemic (ACM Trends #4.2 and #4.7).
By Spring 2021 many museums were welcoming visitors back into their spaces, with new safety protocols in place and varying capacity restrictions. Museums rely on these patrons to sustain operations. When we reviewed 2018 990 financial data from 218 museums in the ACM member network, our analysis showed that the median institution (regardless of size) relies on program services income (this includes income derived from admissions, events, and other general operational activities) for roughly 45% of its total income. Attendance directly impacts how museums balance income and expenses. By the time of this survey in Spring 2021, the numbers of visitors to the museums had not returned to pre-pandemic levels. This dip continues to impact children’s museums’ income.
To track how the field’s attendance had changed throughout the pandemic, we captured monthly total attendance numbers from March 2019 to March 2021. Sixty-two museums responded to this portion of our Spring 2021 survey. From this data set, we know that the average museum was open to in-person visitors for 34% of the total days during the pandemic’s first year than the year prior. Additionally, based on survey data from 52 museums, we know that in March 2021 attendance for the average museum remained at 26% of pre-pandemic attendance levels.
Knowing that museums rely on their patrons for 45% of their total income from program and services revenue, we asked for up-to-date data, as of March 2021, on fundraising during the pandemic. Specifically, we looked at governmental and non-governmental funding sources. As we reported in ACM Trends Report 4.7, the median value of funding from governmental sources in September 2020 was $205,000 (N = 96). Of the 96 museums responding, 77 had approached private funders (ACM Trends #4.13) with an average return of $50,000.
A second round of Paycheck Protection Program (PPP) funding was awarded in early 2021, in time for award announcements before the Spring survey. At this time, most museums responding to the survey (n = 80) reported moderate success in obtaining government funds during and related to the COVID-19 pandemic, exhibiting an 80% success rate with a median value of almost $400,000. Appeals for private funding were even more successful (98% success rate) but yielded smaller amounts, with a median value of just over $100,000.
Two new streams of funding were available to museums to apply for through the American Rescue Plan Act and the CARES Act. In March 2021, nearly one-third of museums (n = 27) indicated that they had applied or intended to apply for a Small Business Administration Shuttered Venue Operators Grants (SVO). At the time of the survey, SVO had not yet been distributed.
Additionally, just over one-third of museums (n = 32) indicated that they had received Employee Retention Tax Credit (ERTC) funds, with the median museum receiving $290,328. We have not collected further data on either the ERTC or SVO at this point.
Fundraising success is about more than securing grants. Museums are constantly looking for new funding sources and streams and setting goals to meet operating budgets. This remained true during the pandemic. Reviewing 218 museum’s 990 information, we found that the median museum relied on donations for almost half of their total income. In the Spring 2021 survey, we asked children’s museums whether their fundraising efforts were more successful, just as successful, or less successful during the first pandemic year (March 2020 – March 2021) compared to the previous year. Three-fourths of museums indicated that fundraising was just as or more successful during the first pandemic year (n = 79).
In Spring 2021, children’s museums were generally confident that they could meet their financial obligations one year on in Spring 2022. Eighty museums responded to the question “How confident do you feel that your museum will be able to maintain its financial obligations to maintain operations a year from now?” on a scale from Not at all confident to Very confident. Slider responses were recorded as numerals between 0.00 and 1.00, accordingly.
Seventy-three museums responded with a degree of confidence equal to or higher than 0.5, indicating that museums had found a way to compensate for the financial hit caused by drastically lower attendance numbers.
Government funding proved vital for many museums. Overall, their fundraising success during the pandemic seems to have stimulated children’s museums’ confidence.
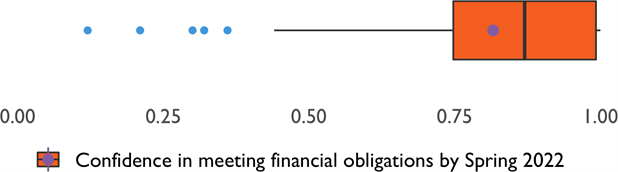
Figure 1.Confidence in meeting financial obligation by Spring 2022. (n = 80)
Figure 1 above is a Box and Whisker Plot displaying the responding museums’ confidence (n = 80). We will explain each element of the Box and Whisker Plot and what it shows about our data. Box and Whisker Plots are useful for displaying the range of values in a dataset, including the median value and quartiles of the data’s spread. Each quartile includes 25% of responding museums. Here, the orange box shows us the second quartile, the third quartile, and the median values of our data. The median is represented by the vertical line down the middle of the box. The left “side” of the box displays the second quartile, and the right “side” of the box displays the third quartile. The purple dot in the second quartile is the mean, or average value, of our data set. The whiskers, or the horizontal lines, on either side of the box show us the first and fourth quartiles. The five blue dots ranging between 0.10 and 0.45 are outliers.
So, what does all this mean in the context of museums’ confidence in meeting their financial obligations? By looking at the median, we can tell that the middle value of our data set represents a museum that is quite confident that it will meet its financial obligations in Spring 2022.
On a scale where a rating of Not at all confident yields a value of 0.00 and a rating of Very confident yields a value of 1.00, a median value of 0.85 reflects fairly high confidence. Meanwhile, the orange box tells us that half of the museums in the dataset, or 40 out of 80 museums, are moderately to very confident that they will meet their financial obligations in Spring 2022.
The short right whisker tells us that 20 museums are very confident in their ability to meet their financial obligations. Of the remaining 20 museums, five (represented by the blue dots) are less than confident about meeting their financial obligations. The box’s long left whisker shows that the first quartile of museums is somewhat confident in meeting their financial obligations. The takeaway is this: 75% of the museums in this data set are moderately to very confident that they can meet their financial obligations in Spring 2022. In the following sections, we explore the reasons for their optimism.
Every museum has a unique rationale for any confidence it has about its late- and post-pandemic future. However, we identified six general categories that illustrate why museums are right to feel confident. Thirty museums referenced a diversified funding stream, including federal and local government funding as well as private funding, as a reason for confidence. Twenty-seven museums have been encouraged by attendance during their re-opening phases and have received more visitors than anticipated. Twenty-three museums indicated that a reduction in operational spending as part of a long-term planning strategy, along with current cash reserves, meant they could be confident about meeting future operational needs.
Unfortunately, but unsurprisingly, reducing operation spending also included a reduction in staff. We detail the impacts of staffing over the course of the Pandemic in ACM Trends Report #4.12.
Additionally, seven museums in our data set either belong to a larger museum/university structure or are completely funded by local government and have moved to more sustainable budgets to ensure future operations. Finally, one museum mentioned that rent reduction has been helpful, and four museums moved into new spaces with higher capacity and lower operating costs.
In the past year, museums have reimagined their operations and service to their communities, and this has affected their staff. During an ACM Leadership call in Fall 2021, about 6-months after the Spring 2021 survey, ACM and Knology followed up with roughly 20 ACM member museum leaders to hear if they were still confident in meeting their operations’ budgets in 2022.
With attendance not yet back up to pre- pandemic levels, museum leaders’ confidence in meeting financial obligations in 2022 was high yet speculative. On a scale of 1 (least confident) to 5 (most confident), museum staff on the call indicated confidence between 3 and 5, with specific caveats and new concerns. Key concerns centered around the continued need for federal and state governmental funding to fill in the gaps of lowered earned revenue. Specifically, the Shuttered Venue Operating Grants and PPP loans were still covering many 2021 costs and were projected to continue to support museum operations into 2022. A second round of SVOG and funds from the Employee Retention Tax Credit were noted as potential future governmental funds that these museums were banking on. A museum CFO noted that, “Once the federal funding runs out, our confidence drops off tremendously not knowing which direction covid stats are going to go. Just when we thought it was getting back to ‘normal’ the Delta variant picked up. What’s next?” This was met with widespread agreement from others in attendance.
Museums staff noted that donations from individuals and foundations were starting to taper off, with many noting that perceived “sympathy giving” at the height of the pandemic in 2020 was not as common in Fall 2021. Many did not expect their fundraising to be as successful in 2022 compared to their early pandemic success.
We will continue to monitor the state of the children’s museum field into 2022 to understand how these concerns impact their missions and operations.
The data used in this report came from an online survey that ACM sent to US-based children’s museums. Overall, 91 museums responded to at least part of the survey. All participating museums were based in the US. Additional data was collected through an ACM Leadership call discussion forum where data was presented back to museum leaders for their response.
Flinner, K., Voiklis, J., Field, S., Attaway, E., Gupta, R., & Fraser, J. (2020). Museums in a Pandemic: Financial Impacts. ACM Trends 4(2).
Flinner, K., Voiklis, J., Field, S., Thomas, U.G, Attaway, E., & Gupta, R. (2021). Museums in a Pandemic: Diversifying Funding Streams. ACM Trends 4(7).
Flinner, K., Field, S., Voiklis, J., Thomas, U.G., & ACM Staff (2021). Museums in a Pandemic: Personnel & Rebuilding Teams. ACM Trends 4(12).
Fraser, J., Field, S., Voiklis, J., Attaway, E., & Thomas, U. G. (2021). Museums in a Pandemic: Patterns in Fundraising. ACM Trends 4(13).
This project was made possible in part by the Institute of Museum and Library Services. The views, findings, conclusions or recommendations expressed in this publication do not necessarily represent those of the Institute of Museum and Library Services.
The Associations of Children’s Museums (ACM) champions children’s museums worldwide. Follow ACM on Twitter, Facebook, and Instagram. Knology produces practical social science for a better world. Follow Knology on Twitter.
| This post was originally published as ACM Trends Report 4.13, the thirteenth report in the fourth volume of ACM Trends Reports, produced in partnership between ACM and Knology. |
Since May 2020, the ACM Trends Report team has tracked the impacts of the pandemic on children’s museums and the field’s innovations through survey studies and other data collected by ACM.
This ACM Trends Report presents data from 28 museums that shared information on their donors and funds received by Spring 2021. This includes 147 corporate donations and 119 private foundation donations made to children’s museums. Corporate donations were stratified into categories by type of donor. We also collected data on whether the funds were provided as restricted or unrestricted gifts. To understand the pandemic’s impact on donations, this information was benchmarked against 2018 fiscal year 990 data. Comprising the most complete data to date, the 2018 fiscal year represents the pre-pandemic fiscal year for all organizations.
Three small museums, 10 medium museums, and 11 large museums provided information on corporate donations received during the pandemic. We also learned about a few extraordinary donations that represented historical commitments to large children’s museums, which should not be considered typical of the day-to-day fundraising expectations.
This early assessment of donor type, scale of donation, and comparisons helped us learn how to support comparison between museums irrespective of scale.
We normalized the data by comparing the percentage of total income from corporate and private funding received during the 2018 fiscal year to the percentage of total income from corporate and private funding received during the pandemic. This way, we were able to develop clear benchmarking that can be used by all children’s museums to consider their relative prospecting success and opportunities in their markets. This report focuses on understanding how to benchmark and set reasonable expectations for donation size as our field emerges from the pandemic.
An assessment of the 2018 nonprofit tax filings for all ACM member museums showed that an average children’s museum receives 47% of total income from donations and gifts. While some museums rely more heavily on donations than others, museum size did not impact total percentage of income from donations.
Museum development teams build an understanding of their local supporters and focus on relationships that can last over time. As a result, many of these gifts may be a function of annual giving unique to each community. This report focuses on whether there are patterns to giving that can help museum leadership set expectations. The context for this study was the COVID-19 pandemic and the 2020 civil rights protests, which caused donors to reconsider their funding priorities.
We explored a snapshot of fundraising results from the 2020 pandemic year to assess how these varied from pre- pandemic times. We also looked at donors by industry to aid in benchmarking anticipated gifts from any representative of the sector, and whether being part of a local, regional, or national brand impacted the size of gifts.
Twenty-four museum respondents reported corporate donations received during the pandemic. These donations ranged from $100 to $100,000. Most donations were below $5,000 (Figure 1). Around 2/3 of donations (n = 98) were gifted as unrestricted funds, 40 were completely restricted, and six were partially restricted. Larger donations were more likely to have restrictions attached.
Let’s walk through how to read this figure. Each black circle represents an individual donation from a corporation or corporate foundation. The purple line shows the mid-point (median) of the distribution of donations. The orange line represents the average (mean) corporate donation in this dataset. The mean is calculated by summing up all the numbers in a dataset and then dividing by the number of values in the dataset. This is different from the median which refers to the middle number when a set of numbers is placed in order smallest to largest. Three outlier donations (two of $70,000 and one of $100,000) are not shown in Figure 1 but are included in calculations.
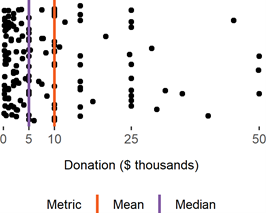
Figure 1. Corporate donations reported by museums.
Because firm size and industry impact corporate giving (Amato & Amato, 2007), we categorized the set of corporate donations by industry and discovered that different-sized corporate donors gave varying gift amounts. To understand how to benchmark these gifts for comparison purposes, we suggest that is more relevant to consider the “median” donation rather than the “mean,” as one large donation to one museum can skew the results of the average.
Let’s walk through how to read the next pair of figures. Here, the circles represent donations from corporate donors and corporate foundations to children’s museums. The purple circles show the median donation for each industry while the orange circles show the mean donation for each industry.
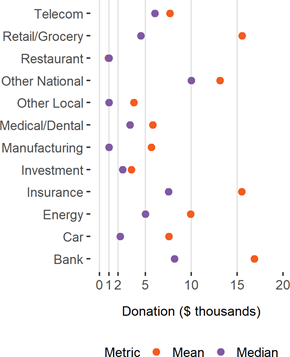
Figure 2. Comparing the mean and median donation to children’s museums from corporate donors and corporate foundations.
Our analysis of this small dataset suggests a few things, but we would need additional data to more fully understand the funding patterns of corporate donors and make recommendations as to how children’s museums might approach them. These data suggest that if a museum were to approach an energy company for funding, they might be more likely to succeed if they explain that many children’s museums are supported by energy companies at the $5,000 level, but a few energy companies make large gifts that average $10,000.
While this approach may seem to reduce the potential gift, it helps to establish two norms or social expectations for the industry that could benefit children’s museums in the long term. Industrial and organizational research has shown that corporate donations are likely to level to match the norms for their industry, but are modified by regional norms across industries (Marquis & Tilcsik, 2016). Presenting funding request in this way may increase willingness of corporate donors to consider small gifts that were not on their priority list because they wish to represent their corporate citizenship as consistent with industry standards.
We also categorized corporate donations by the service territory. National brands were more likely to donate in the $10,000 range, regional brand gifts were at the $5,000 level, while local businesses hover around $1,000 (Figure 3). As noted, these are early findings, and we will continue to gather additional data in future surveys.
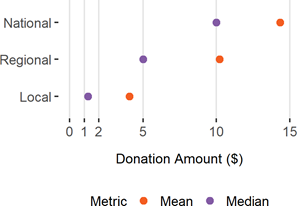
Figure 3. Comparing mean and median donations to children’s museums based on corporate reach.
The complete corporate funding data represents information from 24 children’s museums, a number too small to generalize across the field. A qualitative comparison of these data does suggest that in 2020, larger museums faced more challenges securing donations that matched historic patterns. In our data, medium sized museums fared better than their larger counterparts, but only a few maintained the pre-pandemic pace. Figure 4 presents a picture of 2020 corporate and private donations and the shortfall from 2018. To create the graph. we normalized the 2018 data for every museum to 100%, then divided 2020 funding into three categories and added a fourth representing 2020 donation shortfall compared to 2018. Private philanthropy in 2020 was by- far the most important category for supporting museums at about 3x the value of corporate donations (Figure 4), but still well below pre-pandemic levels of support.
Figure 4. Corporate and Private Donations to Museums as % of all donations reported in 2018.
Fundraising in the pandemic was vitally important for most children’s museums to fill the loss of earned income. As explored in earlier reports in this series, many museums reimagined their operations and services to accommodate fiscal realities, including a recognition that donors were reprioritizing funding. This ACM Trends Report shares data demonstrating useful patterns in fundraising, which can inform how museums can leverage industry norms to launch new requests to local, regional, and national corporations. However, more data needs to be collected to pain the full picture of corporate and private giving. In this report, we also normalized data by museum size to allow for comparisons irrespective of scale, while still allowing us to understand how scale will continue to influence public support for children’s museum funding.
The data used in this report came from an online survey that ACM sent to US-based children’s museums, and the 990 public tax filings of all U.S. children’s museums who are members of ACM.
Amato, L. H., & Amato, C. H. (2007). The effects of firm size and industry on corporate giving. Journal of Business Ethics, 72(3), 229-241.
Flinner, K., Voiklis, J., Field, S., Thomas, U.G, Attaway, E., & Gupta, R. (2021). Museums in a Pandemic: Diversifying Funding Streams. ACM Trends 4(7). Knology & Association of Children’s Museums.
Marquis, C., & Tilcsik, A. (2016). Institutional equivalence: How industry and community peers influence corporate philanthropy. Organization Science, 27(5), 1325-1341.
This project was made possible in part by the Institute of Museum and Library Services. The views, findings, conclusions or recommendations expressed in this publication do not necessarily represent those of the Institute of Museum and Library Services.
The Associations of Children’s Museums (ACM) champions children’s museums worldwide. Follow ACM on Twitter, Facebook, and Instagram. Knology produces practical social science for a better world. Follow Knology on Twitter.
| This post was originally published as ACM Trends Report 4.12, the twelfth report in the fourth volume of ACM Trends Reports, produced in partnership between ACM and Knology. |
Since May 2020, the ACM Trends Report team has tracked the impacts of the pandemic on children’s museums and the field’s innovations during this time, through survey studies and data gathered through ACM’s Museums Mobilize initiative. ACM member museums completed surveys in spring 2020, fall 2020, and spring 2021, as well as participated in discussion and reflection on a regular basis.
This ACM Trends Report presents new data on museum personnel from 91 museums that participated in the spring 2021 survey, compared to previous data measuring changes in personnel throughout the pandemic. The pandemic has affected museum personnel of all types, from full-time and part-time workers to contractors and volunteers. In particular, the status of part-time workers dramatically changed over time. Museums estimated that, on average, about a quarter of part-time employees remained at their pre-pandemic capacity by spring 2021. Meanwhile, about half of full-time workers were at their normal capacity by that time. Children’s museums decreased volunteers and contractors’ work as well. As we’ve seen in previous reporting, museums and their teams creatively transformed personnel roles and responsibilities over the course of the pandemic.
There are signs that museums are beginning to rebuild their teams. About half reported they were in the process of rehiring both full-time and part-time staff. Rebuilding the workforce will be an important part of reimagining how children’s museums serve their communities.
Children’s museums are operated by a mix of personnel types. In a 2018 analysis, children’s museums’ teams were composed of an average of 8% full-time workers, 16% part-time staff, and 76% volunteers, in addition to contractors. However, each group worked very different hours, with full-time staff annually averaging about 2,000 hours, part-time staff about 1,000 hours, and volunteers about 150 hours (Flinner et al., 2016; Bureau of Labor Statistics, 2017). The COVID-19 pandemic shifted the landscape for children’s museum personnel.
Since the beginning of the pandemic, children’s museums navigated financial shortfalls by laying off, furloughing, or reducing hours for their full-time and part-time workers. Over the course of the past year, institutions were more likely to keep full-time employees staffed at their normal capacity, compared to part-time staff’s typical levels.
During this period, retention rates for part-time staff were roughly half that of full-time workers.
Figure 1. Percentage of staff whose employment status remained normal during the pandemic, as estimated by museums.
Figure 1 illustrates the changes that took place in staffing at three points in time: spring 2020, fall 2020, and spring 2021. Let’s walk through how to read this chart, which visualizes statistics known as confidence intervals. The solid center marks indicate the average percentage of staff with no changes to their employment status at each point in time. These percentages were estimated by the museums and were not precise counts. Since not all ACM members participated in the survey, there is a degree of uncertainty in the averages. The chart indicates this uncertainty with the shaded boxes that surround the solid marks, also called ranges. We calculated that 95% of museums’ estimates on staffing would fall within the shaded boxes. The more museums that respond, the more accurate and tighter the ranges would be.
Let’s also discuss how to interpret the significance of the changes over time in Figure 1. A “significant change” means that the shift is not simply due to chance – in other words, there is a high probability that there is indeed a shift in the thing being measured. In this chart, we can detect significant changes by looking at a center mark at one point in time and comparing it to the range at another point in time. If there is overlap, the change might be due to chance. But if the center mark does not overlap with the range at another point in time, then the change is likely meaningful. In Figure 1, for instance, the change in estimates of full-time staff retention is not significant from spring 2020 to fall 2020, whereas it is from spring 2020 to spring 2021.
There are several things that likely influenced museums’ capacity to retain staff since the beginning of the pandemic. Most children’s museums received support from the first round of the Paycheck Protection Program (PPP 1) offered by the Small Business Administration (SBA) in spring 2020. PPP 1 funds came with stringent requirements for staffing and payroll in spring 2020, but these conditions eased by the time of the second survey in fall 2020. Museums had to fulfill PPP 1 spending requirements by December 31, 2020.
The SBA was in the process of allocating the second round of PPP funding (PPP 2) at the time of the spring 2021 survey. Fewer children’s museums applied for PPP 2 funds, but success rates were still high. These funds have the same more relaxed requirements relating to staffing and payroll as were used in PPP 1. However, it seems museums continued to struggle to keep both full-time and part-time workers employed at their pre-pandemic levels.
There may be other factors affecting staffing and hiring. Museums increasingly opened their doors to in-person audiences when infection rates were falling and vaccination rates were rising across states. In early 2021, some states started to pull back unemployment benefits that had been expanded at the beginning of the pandemic. This shift may also have affected hiring for some children’s museums.
In 2016, Small and Medium museums worked with an average of 36 volunteers, and Large museums worked with an average of 380 volunteers (Flinner et al., 2018). By spring 2021, less than half of the 69 responding institutions reported working with volunteers. Before the pandemic, museums tended to recruit volunteers from all age groups, beginning with 15 to 17-year-olds through people age 55 and up. Those working with volunteers in spring 2021 continued to recruit from a wide range of age groups, except for ages 15 to 17.
Prior to the pandemic, volunteers served primarily by interacting with visitors. These visitor-facing roles consisted of facilitating exhibits, programs, and events. In the past year, museums have reduced volunteers’ work in this area, though it remains the most common task via virtual and online platforms. Nine museums reported reassigning volunteers to creating kits or packets for distribution to community members. Prior to the pandemic, volunteers also supported administration and operations, such as preparing materials, stocking supplies, cleaning, and maintaining collections. Museums reduced these types of volunteer tasks during the pandemic.
In spring 2020, nearly all museums working with contractors laid off some or all of these workers. By spring 2021, nearly all museums that staffed contractors before the pandemic had resumed working with this category of personnel. Eight museums that had not hired contractors before the pandemic reported doing so over the last year. These institutions primarily hired contractors for operations and administrative support.
Out of 69 museums that provided information about contractors, about two-thirds reported using contractors’ services both before and during the pandemic. Exhibits and programming was the most common area for contractors’ work before the pandemic, while operations and administrative support was the most common contractor role during the pandemic. There were fewer museums that continued to work with contractors on facility maintenance and exhibits and programming during the pandemic, compared to their pre-pandemic rates.
More museums reported working with IT and web services contractors during the pandemic compared to their pre-pandemic practices, though fewer than half of participating institutions did so.
Museums are in the early stages of rebuilding their teams through hiring. Sixty-nine museums specified their current status on hiring different types of staff. Half were rehiring
both full-time staff and part-time staff. Of these institutions, most looked to hire new employees, and about half also recruited from staff who had been furloughed or laid off during the pandemic. Some museums may also be bringing volunteers and contractors on board instead of or in addition to hiring part-time and full-time workers.
We anticipate that museums’ efforts to rebuild their teams will increase in the next few months. Institutions will continue to re-open for in-person activities and PPP 2 funds will be fully distributed. Vaccination rates may increase across the country, which will make the workplace safer. Meanwhile, states may continue to restrict unemployment benefits, which could encourage more people to return to work.
The past year has seen museums reimagine their operations and service to their communities. To continue on this path, children’s museums must also rebuild their personnel. What roles can be reshaped? Which skills might a team possess that the museum has not yet tapped into? How can the museum fill the gaps in skills and experience – through training, new hires, or learning with and from peer institutions? Many museums will need the support of funders and stakeholders to access the resources to rebuild teams. We can look to the 2018 Trends Report series on economic impact for guidance on how to articulate the value of children’s museums as economic engines in their communities. This research found that children’s museums supported 57,000 jobs in the US, of which 41% are outside of their walls. For every full-time position within a museum, the institution supported nearly 1½ external jobs through spending on vendors and employees’ spending. Museums’ spending supports specific industries, typically health and social services, retail, real estate, and hospitality, though there are differences across regions (Voiklis, Fraser, et al. 2018; Voiklis, Flinner, et al., 2018). Leaders can use these statistics, along with data from their own institution, to make the case for gaining support for their rebuilding process.
The data used in this report came from an online survey that ACM sent to US-based children’s museums. Overall, 91 museums responded to at least part of the survey. All participating museums were based in the US.
Bureau of Labor Statistics. (2017). American Time Use Survey – 2016 Results. Washington, D.C.: U.S. Department of Labor. https://www.bls.gov/news.release/pdf/atus.pdf. Accessed December 13, 2017.
Flinner, K. Fraser, J., & Voiklis, J. (2018). Making a Museum Sing: the Children’s Museums Workforce. ACM Trends 1(10). New York: Knology & Association of Children’s Museums.
Voiklis, J., Flinner, K., & Fraser, J. (2018). The Economic Impact of Children’s Museums: Our Jobs, Their Jobs, All Jobs. ACM Trends 2(2). New York: Knology & Association of Children’s Museums.
Voiklis, J., Fraser, J., & Flinner, K. (2018). The Economic Impact of Children’s Museums: The Ripple Effect of Spending. ACM Trends 2(1). New York: Knology & Association of Children’s Museums.
This project was made possible in part by the Institute of Museum and Library Services. The views, findings, conclusions or recommendations expressed in this publication do not necessarily represent those of the Institute of Museum and Library Services.
The Associations of Children’s Museums (ACM) champions children’s museums worldwide. Follow ACM on Twitter, Facebook, and Instagram. Knology produces practical social science for a better world. Follow Knology on Twitter.
| This post was originally published as ACM Trends Report 4.10, the tenth report in the fourth volume of ACM Trends Reports, produced in partnership between ACM and Knology. |
The ACM Trends Report team has continued to study the effects of the COVID-19 pandemic on children’s museums. To understand these impacts, we conducted multiple surveys: the first in May 2020, the second from September 24 to October 18, 2020, and a third in spring 2021. The Museums in a Pandemic series of Trends Reports illustrates the ways children’s museums have adapted to the evolving national and local situations surrounding the pandemic.
In the fall 2020 survey, 81 museums reported starting new collaborations or expanding existing collaborations since the beginning of the pandemic. Meanwhile, 15 reported no new or expanded collaborations. Those with collaborations started an average of two or three collaborative activities during the pandemic. In this Trends Report, we will explore collaborations that children’s museums formed with other museums and different kinds of cultural institutions.
This is the second of three Trends Reports that tell the story of how children’s museums have undertaken collaborative work during a time of crisis. These three reports are also part of Museums Mobilize, an initiative of the Association of Children’s Museums that documents COVID-specific responses and innovations by children’s museums.
Figure 1. Goal of children’s museums’ collaborations with other museums and cultural institutions.
We asked museums whether they had expanded existing collaborations or initiated new collaborations with different types of organizations during the pandemic. Out of 96 museums, 52 museums or 54% reported collaborations with other museums and cultural institutions including aquariums, botanic gardens, libraries, and zoos. Participants were also asked about the goals for their expanded or new collaborations.
Partnerships with other museums and cultural institutions were most likely to focus on sharing resources and information and COVID-19 planning (Figure 1). This was followed by cross-institution promotion, with outreach as the third most common goal. Supporting students during the school year was the least common goal for children’s museums. In contrast, museums that formed partnerships around social and health services were most likely to focus on sharing resources and information.
What follows are short stories from two children’s museums about specific collaborations they have developed with other cultural organizations.
Building for Kids (BFK) Children’s Museum, located in Appleton, WI, is collaborating with the History Museum at the Castle, also in Appleton, on an initiative called Museums in Motion: Responsive Community Engagement Toolkits. The initiative is supported largely through funding from the City of Appleton’s Community Development Block CARES grant.
Through the program, the museums provide hands-on, non-virtual educational enrichment activities that can be done at home and are designed to support the educational and social needs of students in the community during the pandemic. Each kit contains materials and instructions for six projects. Three projects were developed by the History Museum, and three by BFK. Projects provide students with a chance to do things like learn about Harry Houdini, experiment with graphite circuits, and create mini robots. In its first wave, Museums in Motion is distributing 1,200 engagement toolkits to first graders and their
families in the Appleton Area School District. Kits will also be distributed to low-income households that have students in Kindergarten through second grade, with support from Pillars, a network of shelters for homeless persons, and Harbor House, which supports people in domestic abuse situations. Through this initiative, BFK is seeking to support the resiliency of students and their families during the pandemic and in the future.
BFK is also collaborating with Fox Valley Symphony Orchestra (FVSO) on the Be a Percussionist and Meet a Musician initiatives. These programs, offered on Facebook, provide live music education to children at home. In Be a Percussionist, audiences explore different musical concepts and learn about several kinds of percussion instruments. Meet a Musician features FVSO artists who discuss topics such as conducting, composition, and instrument families. The museum is also collaborating with FVSO and the Appleton Public Library (APL) on Symphony Storytime, which provides families with engaging and meaningful virtual programming. Under this initiative, FVSO musicians compose music to accompany stories read by librarians from APL. BFK provides puppets and other props that are used as part of story time.
Commenting on the value of the programming to the community, museum leadership noted the detrimental impact of the COVID-19 pandemic on the education and development of children and families, and how cultural institutions can play a supportive role. “Families with early elementary school-age children are especially impacted. With schools closed and students learning virtually from home, parents become educators tasked with delivering formal schooling with children that typically rely heavily on engagement from their teachers and peers,” they said.
BFK’s leaders believe that museums can step in as valuable sources of out-of-school-time learning, engagement, and connection to the community: “While visits to museums are limited, these non-virtual, hands-on learning toolkits help equip families with tools to mitigate this learning loss. Without investment in mitigating the disproportionate impacts on economically disadvantaged children and families, our community will experience an imbalanced and unequitable recovery from this crisis.”
The museum’s virtual music programming is also intended to provide greater opportunities for families to continue to connect during the pandemic. One leader remarked, “BFK’s mission is to inspire discovery and build resilience through intergenerational, play-based learning and exploration of the arts, sciences, and humanities. We feel that offering this programming connects us to families and exposes them to different concepts in music and fulfills our mission as an organization.”
KidsQuest Children’s Museum, located in Bellevue, WA, is partnering with various organizations to offer families in its community multiple options for virtual learning. The first program, called Remote Learning Kits, is offered in partnership with Boys and Girls Club of Bellevue, King County Housing Authority, Jubilee Reach, King County Library, Bellevue School District, and Kindering. Best Starts for Kids, Schools Out Washington, Boeing, and Big Ideas Learning fund the program. These partnerships were formed through an initiative called the Eastside Pathways Collaborative. With Remote Learning Kits, KidsQuest provides a way for families at home to take part in their favorite museum activities. Kits contain materials that can be used multiple times and in various ways. The activities are designed for open-ended learning that can be completed at each child’s pace. They are intended to support developmental learning alongside regular schoolwork.
These kits are part of the museum’s school-age and preschool programming. The kits are generally designed for children in preschool up to 5th grade, and the museum has offered at least one kit, focused on science and art, for students up to 8th grade. Kits are circulated in two ways: as part of a free program in which the museum works with a local partner to distribute the kits, and as part of a fee-based program open to the general public. Available in both English and Spanish, the kits are typically dropped off at a site that families in the community use to access other kinds of services.
This particular partnership program existed prior to the COVID-19 pandemic but was offered only in person at partners’ spaces with museum educators. For the past three years, KidsQuest and its partners focused on supporting families that were experiencing homelessness. Following the emergence of the pandemic, museum leadership noted, “We have shifted from just students experiencing homelessness to any family who may be struggling. How do we make sure there are not gaps in service and new families are getting learning materials that they need while at home?”
A second KidsQuest initiative is the Love of Learning podcast. Each episode of the podcast features interviews with educators and community partners who share valuable resources and activities that help keep families connected through play. The museum has partnered with guests from other cultural institutions including a local library. Recent episodes have focused on various topics from STEAM areas including math, arts, and engineering. The podcast is designed for parents and caregivers with children ages 0-10 interested in encouraging and engaging in child-directed play, as well as fellow informal educators. All episodes are available on various platforms including Apple Podcasts and Spotify.
Commenting on the value of its educational programming for the children and families in its community, KidsQuest leadership remarked, “We are able to put the power of play and learning into more people’s hands. A couple of new institutions are using our kits as their learning tools during therapy or in-home visits.”
A third initiative called the Tri-Museum Collaborative involves three museums: KidsQuest, Children’s Museum of Tacoma – a program of Greentrike, and Imagine Children’s Museum in Everett, WA. This collaboration is funded in part by Boeing. The goal of the initiative is to promote play among children who do not have access to early learning opportunities. During the pandemic, this partnership was strengthened and used over and over again as the museums shifted to virtual programming. The partners share ideas, strategies, and resources on how best to deliver programming online to support early learning for children in underserved areas of their respective communities. KidsQuest leadership observed that being part of this collaborative effort “allows us to learn what has worked for different populations and how we can continue to adapt our programs to fit the families.”
The stories in this Trends Report showcase children’s museums that have collaborated with peer cultural institutions to combine resources, share insights for their practice, and develop new programming. The types of partner institutions vary widely, from other children’s museums, to history museums, to orchestras. The diversity of these collaborations points to an underlying opportunity for the museum field: joining forces with peers is often better than competing for funding and other resources. When institutions team up, they signal sophisticated organizing capacity and the promise of greater reach into their communities. Children’s museums can use this approach to not only deliver on their mission, but also to expand the ways they achieve their goals of supporting children and families.
Some of the data used in this report came from an online survey that ACM sent to US-based children’s museums. Overall, 96 museums responded to at least Some of the data used in this report came from an online survey that ACM sent to US-based children’s museums. Overall, 96 museums responded to at least part of the survey. A subset of museums that indicated they had new or expanded partnerships received an additional set of questions that asked for more information about collaborations with other museums and different cultural organizations that they formed during the pandemic.
This project was made possible in part by the Institute of Museum and Library Services. The views, findings, conclusions or recommendations expressed in this publication do not necessarily represent those of the Institute of Museum and Library Services.
The Associations of Children’s Museums (ACM) champions children’s museums worldwide. Follow ACM on Twitter, Facebook, and Instagram. Knology produces practical social science for a better world. Follow Knology on Twitter.
| This post was originally published as ACM Trends Report 4.11, the eleventh report in the fourth volume of ACM Trends Reports, produced in partnership between ACM and Knology. |
The ACM Trends Report team has continued to study the effects of the COVID-19 pandemic on children’s museums. To understand these impacts, we conducted multiple surveys: the first in May 2020, the second from September 24 to October 18, 2020, and a third in spring 2021. The Museums in a Pandemic series of Trends Reports illustrates the ways children’s museums have adapted to the evolving national and local situations surrounding the pandemic. For this Trends Report, we also feature a story from an ACM member outside of the US.
In the fall 2020 survey, 81 museums reported starting new collaborations or expanding existing collaborations since the beginning of the pandemic, while 15 museums reported no new or expanded collaborations. Those with collaborations started an average of two or three collaborative activities during the pandemic. This Trends Report will focus on collaborations with schools and universities. This is the third of three Trends Reports that will tell the story of how children’s museums have undertaken collaborative work during a time of crisis. These three reports are also part of Museums Mobilize, an initiative of the Association of Children’s Museums that documents COVID-specific responses and innovations by children’s museums.
Figure 1. Goal of children’s museums’ collaborations with schools and universities.
We asked museums about whether they had expanded existing collaborations or initiated new collaborations with different types of organizations during the pandemic. Out of 96 museums, 55 museums (57%) reported collaborations with local K-12 schools or school districts, and universities or institutions of higher learning. We also asked participants about the goals for their expanded or new collaborations. Partnerships with schools and universities most likely focused on the goal of developing content and programs (Figure 1).
Unsurprisingly, that goal was followed by providing student support in the school year, as well as the objective of sharing resources and information. Cross-organization promotion and outreach was the next most common goal. Fundraising was the least common goal for museums in their collaborations with schools and universities.
What follows are short accounts from three children’s museums about specific collaborations they developed with schools and universities.
The DoSeum, located in San Antonio, TX, collaborated with Celebrate Dyslexia on Beautiful Minds: Dyslexia and the Creative Advantage, an exhibition initiative that celebrated different ways of learning. The collaboration was funded by Celebrate Dyslexia, the City of San Antonio Department of Arts & Culture, and the Elizabeth Huth Coates Charitable Foundation.
The museum’s presentation of the exhibition opened in October 2020 and ended in March 2021. The exhibition’s objective was to illustrate and celebrate the uniqueness of every learner, and to correct popular misconceptions about people who learn differently. It also honored and celebrated learners with diverse strengths. The exhibition offers a variety of spatial and word games, including an oversized tile spelling game, color block puzzles, and digital interactive educational games for children of all ages and their families. The goals of the collaboration, which began before the pandemic, remained the same throughout the project. But the partners adjusted conditions for the pandemic, particularly for the interactive aspects. Specifically, the team integrated motion sensor-enabled interactivity in activities that had traditionally relied solely on touch. To promote social distancing, the museum installed sound domes that feature stories of role models with dyslexia who live in the San Antonio region.
As part of the Beautiful Minds initiative, the museum unveiled an installation by its Artist-in-Residence, called The Reading Brain. This component was designed to immerse children and their families in the inner workings of the brain during reading, through a multi-sensory, data-driven interactive. In the gallery, a sensor detected the movements of guests, and then translated that movement to changing patterns and colors in LED orbs hanging from the ceiling. The installation vividly demonstrated how the brain responds to stimuli, in a way that also enabled guests to socially distance.
The museum reported that Beautiful Minds drew a great deal of interest from educators and caregivers. Teachers visited the exhibition as part of their professional development. As part of the exhibition, Celebrate Dyslexia led a training for participants in City Year, a local service-learning organization, on the experience of dyslexic learners. Other trainees and participants included educators from Southwest Independent School District in San Antonio. For children, the exhibition provided active experiences that both recognize and celebrate neurodiversity. Commenting on the importance of supporting the different ways that people learn, leaders from the museum noted, “With advancements in the learning sciences, it is important to adapt the ways we engage children, caregivers, and educators in public, interactive experiences of STEM, literacy, numeracy, and the arts. Informal learning environments like museums have unique potentials to involve others in emerging tools and models, to inspire and inform stakeholders, and ideally build confidence and curiosity to ultimately foster positive youth development.”
The Children’s Museum of Richmond, located in Richmond, VA, is collaborating with YMCA of Greater Richmond on the YMCA Success Center Enrichment Program. Funding for the partnership is provided in part by the YMCA of Greater Richmond.
The program, launched during the pandemic, provides enrichment to K-4 students participating in YMCA site support for virtual schooling. The program brings in different partners to provide virtual programming after the formal school day finishes for students attending school virtually from YMCA sites. This ensures that children are able to learn in an engaging and fun way in an out-of-school setting. From Monday through Thursday, museum educators provide various activities for two one-hour sessions each day that include movement, a mini-lesson with a literacy element, and a hands-on activity. These activities complement the learning that takes place during the school day. The museum specifically serves students in schools in the City of Richmond and Henrico County, VA. In addition, the YMCA also serves students in Goochland County, VA. Museum leadership called attention to the benefits of the program during the pandemic. Taking place in-person at the YMCA sites, children and their families had access to more interactive and responsive learning opportunities during a time when most education was provided virtually. “Our educators have learned to be nimble, adapt programming for different age groups, and respond to the changing group dynamics. This adaptive skillset is a boon as our education team learns new strategies and gains a deeper knowledge of student needs as they provide more intensive programming and revisit group sites over the school year.” Museum leaders also noted that the knowledge they have gained through this partnership will enhance their traditional program offerings.
Play Africa, a children’s museum located in Johannesburg, South Africa, is collaborating with schools and several early childhood development centers and community groups on an initiative called Heal and Connect. The program is supported by funding from the Government of Canada, through the Canada Fund for Local Initiatives.
Working with local schools and community groups, Play Africa brings parents together through virtual support groups with professional social workers. The museum also reaches out to families with one-on-one phone calls as “Psychological First Aid,” to offer encouragement, information, and links to services in emergency settings.
Through the program, families are supported with educational resources and play-based learning materials for their children. These materials free families to focus on healing, connecting, and cultivating resilience. At the time of reporting, the museum provided resources and information to 5,520 parents and caregivers through this program.
A total of 338 parents have received direct psychological first aid from Play Africa, and 667 children have received play parcels with a range of resources. A total of 680 parents have attended at least one of 15 in-person or virtual parent support groups hosted by Play Africa.
Discussing the value of the program, museum leadership highlighted the fact that since its launch, they have expanded their programming to support 46 schools, daycare centers, nursery schools, and community groups in new areas of Johannesburg and Soweto. These services support vulnerable children and families, including children with disabilities, children who are refugees, asylum seekers or recent immigrants and their families, and children experiencing housing insecurity.
Reflecting on their service audience strategy, the museum explained, “Play helps children make sense of the world, process complicated feelings, and build relationships with others. In this program, we focused on outreach to eight organizations representing children and parents that we felt would most likely be excluded from other crises responses.” Programs led by Play Africa and other children’s museums across the world are offering critical assistance to communities that have been hard hit by the pandemic.
Children’s museums’ partnerships with educational institutions are not unique to the COVID-19 pandemic. But the collaborative activities with schools that emerged in 2020 point to fresh and innovative conceptions of museums’ service to students, school communities, and the education field. As we’ve seen in this Trends Report, many of these partnerships are centered on developing new programs or rethinking projects already in place. In some of these cases, museums drew school audiences to their own facilities for learning experiences. Other institutions have gone to schools and out-of-school providers’ campuses to work with students and educators. Still others have invested in a mix of these approaches. Across all of these education support initiatives, children’s museums have proven to be adaptable and in tune with the needs of their communities. Importantly, museums have defined community broadly, with offerings designed for students, families and caretakers, and teachers. These projects have also extended to university students in training to be educators in child development. We saw an example of this in ACM Trends Report #4.8, which explored museums collaborating with social and health services.
Museum leaders should continue to ask and reflect on how they can support students, educators, and schools. What works well now will likely evolve as communities navigate the changing landscape of education models, public health protocols, and learning needs. In this context, new opportunities for partnerships may also become available.
Some of the data used in this report came from an online survey that ACM sent to US-based children’s museums. Overall, 96 museums responded to at least part of the survey. A subset of museums that indicated they had new or expanded partnerships received an additional set of questions that asked for more information about collaborations with schools and universities that they formed or expanded during the pandemic.
This project was made possible in part by the Institute of Museum and Library Services. The views, findings, conclusions or recommendations expressed in this publication do not necessarily represent those of the Institute of Museum and Library Services.
The Associations of Children’s Museums (ACM) champions children’s museums worldwide. Follow ACM on Twitter, Facebook, and Instagram. Knology produces practical social science for a better world. Follow Knology on Twitter.
| This post was originally published as ACM Trends Report 4.9, the ninth report in the fourth volume of ACM Trends Reports, produced in partnership between ACM and Knology. |
The ACM Trends Report team has studied the impact of the COVID-19 pandemic on the children’s museum field since May 2020, conducting multiple surveys of ACM member institutions. Eighty-nine museums participated in the most recent survey that took place from April 7 to May 11, 2021. Below are several initial findings from this survey:
This project was made possible in part by the Institute of Museum and Library Services. The views, findings, conclusions or recommendations expressed in this publication do not necessarily represent those of the Institute of Museum and Library Services.
The Associations of Children’s Museums (ACM) champions children’s museums worldwide. Follow ACM on Twitter, Facebook, and Instagram. Knology produces practical social science for a better world. Follow Knology on Twitter.
| This post was originally published as ACM Trends Report 4.7, the seventh report in the fourth volume of ACM Trends Reports, produced in partnership between ACM and Knology. |
Since spring 2020, the ACM Trends Reports team has studied the effects of the COVID-19 pandemic on children’s museums. The results illustrate the ways children’s museums have adapted to financial challenges resulting from the COVID-19 pandemic. Specifically, this Trends Report, the seventh in this volume, covers the variety of multifaceted approaches to finding funding sources that museums have adopted as the pandemic has continued, and their success with these methods.
Overall, 96 US-based children’s museums participated in the fall 2020 survey. The data showed that most institutions that applied for funding from federal financial relief programs were successful, and that these funds covered some portion of their expenses. Children’s museums also explored other avenues for raising funds, including from private sources – foundations, corporations, and individual donors. We found that private funders are key to bridging funding gaps in the field. Children’s museums also adopted entrepreneurial strategies, such as renting out facilities for community programming including public health events and voter registrations.
The financial impacts of the pandemic on the museum field are likely to persist for some time. However, the findings in this report show that children’s museums are increasingly resourceful as they seek stability in lean times.
In spring 2020, children’s museums were in the early stages of navigating the financial strain caused by the pandemic. At that time, the federal Paycheck Protection Program (PPP), established by the CARES Act, was in the process of distributing funds to museums and other types of businesses. As we reported in ACM Trends Report #4.2, small museums were most likely to be able to use relief funds to cover the bulk of their expenses, while medium museums were the least likely to have enough relief funds to offset their expenses. A little less than half of large museums used relief funds to cover expenses.
A second round of stimulus funding, planned for spring 2021, brings potential opportunities for new funding from the federal government. The museum community is currently awaiting guidance on accessing these opportunities. Although government funding has helped support children’s museums during the pandemic, there are still gaps. Donations from corporations, private foundations, and individuals are helping to pick up the slack. Evidence from both surveys suggests that in 2020, children’s museums pursued these other funding avenues, with mixed results. By the fall, museums had gained more clarity about their financial picture, though the funding climate remains uncertain. Also, museums took a multifaceted approach to fundraising, with institutions reporting they pursued an average of four sources for pandemic relief funding (including federal funds). This report presents data from 96 museums that participated in the survey, representing all sizes unless noted otherwise.
Most institutions had success with government funding. The most reliable sources for support included PPP, state and local governments, Economic Injury Disaster Loans (EIDL), and State Councils. Some agencies and programs have remained less lucrative for museums. Relatively few museums applied to grants from the Institute of Museum and Library Services, the National Endowment for the Humanities, and the National Endowment for the Arts. Of those that applied, less than a quarter received grants. Of the two museums that applied for the Federal Reserve’s Main Street Nonprofit Loans, only one received support.
Children’s museums reported receiving between a total of $17,500 and $3.7 million from government agencies. To date, the average total amount of government funds to museums participating in the survey was $205,000.
In spring 2020, museums reported having success with private funders, which increased through fall 2020. Out of 96 museums, 77 approached private funders since the beginning of the pandemic and all but two have received support of some kind. Museums approached different types of private funders – foundations, corporations, and individual donors (see Figure 1).
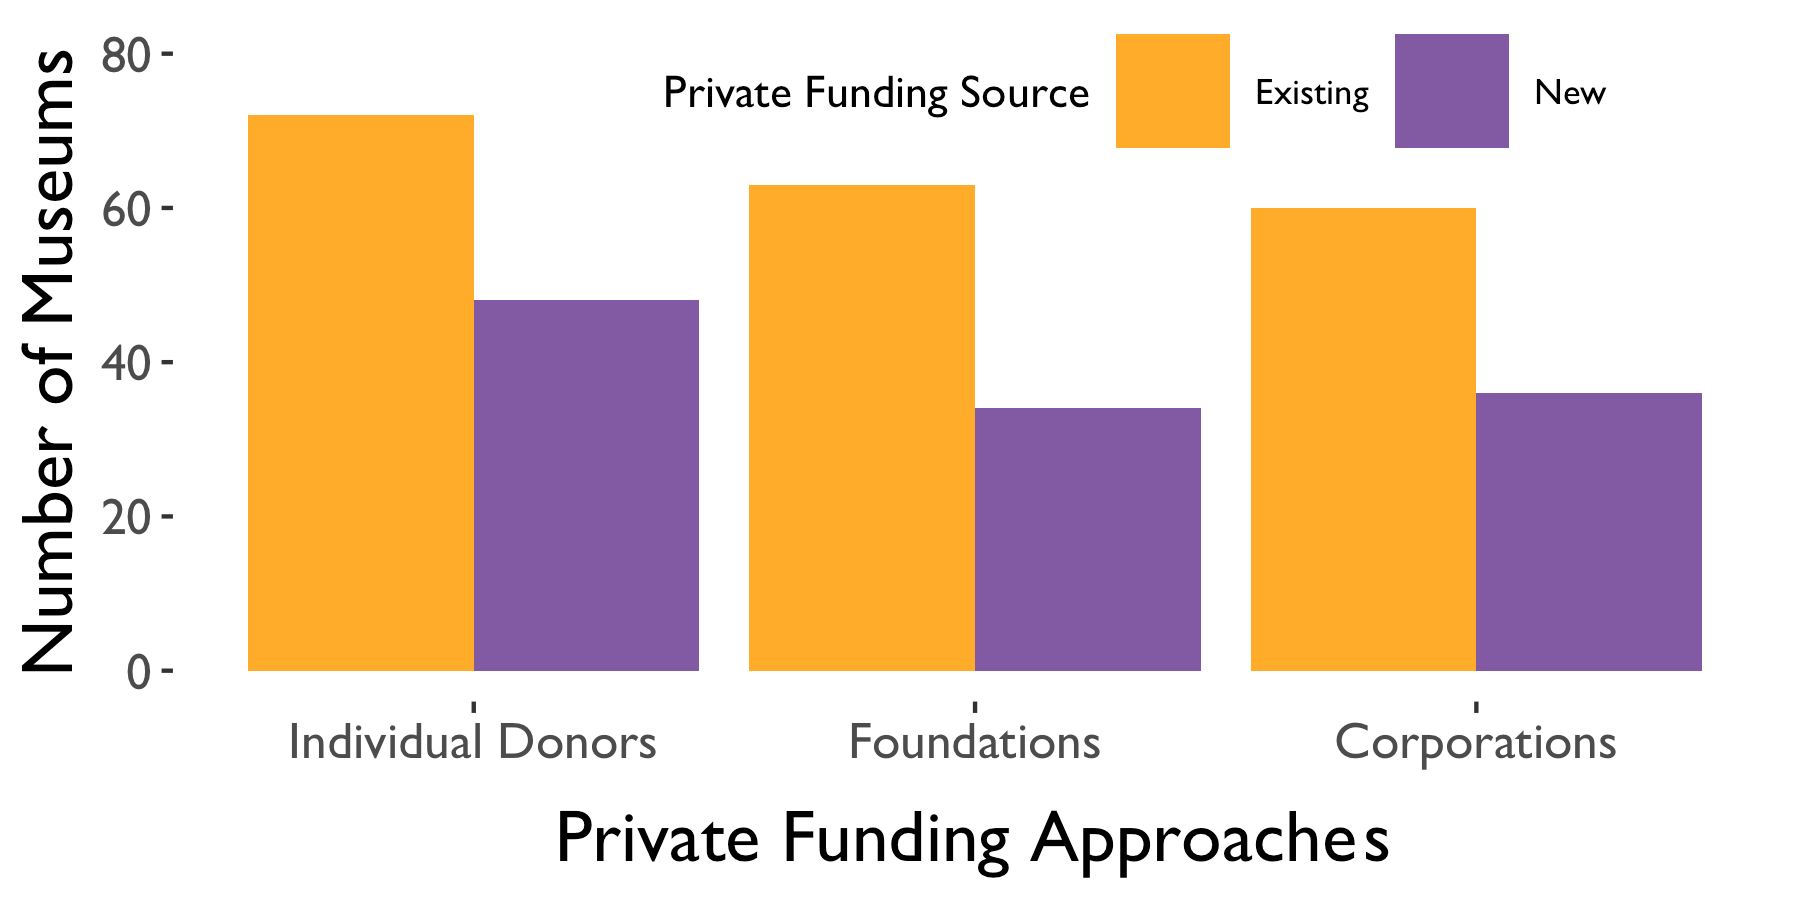
Figure 1. New and existing private funders approached by children’s museums.
They most often appealed to funders they had previously existing relationships with, and half approached new private funders as well. Seeking new private funders did not significantly increase the amount that children’s museums raised overall. Our survey did not specifically ask for breakdown of funding by new and existing private funders, nor how many appeals for funding each museum made within these categories.
All museums which sought private funding reached out to at least one category – corporate, foundation, or individual – of existing funders. Out of 77 museums, 56 also sought private funding from at least one new source.
These efforts have been worth it. Across the children’s museum field, private funders have provided 25% of reported COVID-19 financial relief. For individual institutions, funding amounts ranged widely, from $600 to $1.5 million. To date, the average amount museums reported receiving from private funders was $50,000, which may include support from multiple private sources for some institutions.
Museums tried a host of strategies to gain financial stability, in addition to securing funding from government and private sources. The field is still trying to understand what works, and we are gaining a clearer picture of the opportunities available for children’s museums.
Of the respondents, 80 museums described additional fundraising strategies, which included some typical efforts and re-imagined approaches to conventional museum fundraising. About half of these institutions hosted fundraisers or campaigns. These activities included online and email campaigns, a virtual gala, as well as campaigns focusing on raising capital and supporting relief. A third of museums revised existing funds.
The museum field has long reflected on the value of partnerships. In the pandemic, this topic continues to be important. As children’s museums have experimented with opening their doors to in-person visits or investing in virtual services for their communities, some have also offered their spaces for alternative purposes. These activities primarily consist of programs with community or service organizations, local governments, and schools. Community programs hosted in museum facilities covered range of local needs and services, such as blood drives, English classes for adults, meetings of service or volunteering clubs, local Boys & Girls Clubs, parent support groups, support activities for adults with dementia, health-focused activities, and voter registration. For schools, museums provided space and other resources for virtual schooling pods, learning assistance programs, camps, e-learning, tutoring, labs, and classrooms sites themselves. Out of 95 museums, 17 said they generated revenue through hosting activities in their facilities. All who obtained income reported partnerships with schools, and some also reported collaborations with other organizations or local governments.
Partnerships appear to be associated with funding. There is a moderate correlation between the number of partners that museums mentioned and the different types of new private funders they petitioned. Museums that did not approach new private funders had an average of two partners, whereas those making requests to new funders had double the number of partners. Although we do not know if partnerships made funders more likely to offer support, we know that private funders are an increasingly important source of financial support for the field.
Children’s museums continue to make strides in funding, but there are still challenges. Below, we summarized trends we observed in common financial measures.
Total Income – Based on data from 59 museums for the period of March through August 2020, three-quarters of institutions were operating at less than 59% of their 2019 income level.
Total Expenses – Based on information for 59 museums for the period of March through August 2020, three-quarters of institutions’ expenses were at least 65% of their 2019 expenses, or higher.
Income to Expense Ratio – Based on data from 60 institutions, three-quarters of museums had an income to expenses ratio lower than 87% from March to August 2020. So, for every dollar that these museums spent, they earned 86 cents or less in 2020. By comparison, three-quarters of museums made more than 92 cents for every dollar they spent in the same period of 2019. This means that additional expenditures in 2020 on items like Personal Protection Equipment (PPE) are even more of a stretch for many museums.
The American Alliance of Museums conducted a survey of the museum field in October 2020, which provides additional context. On average, responding museums lost $850,000 as a result of the pandemic. On average, they anticipated losing about 35% of their budgeted operating incomes in 2020, and 28% of their normal operating income in 2021 (AAM & Wilkening Consulting, 2020).
The pandemic and its resulting financial uncertainty have proven to be a challenge for museums everywhere. But data from the first nine months of this new climate shows that children’s museums are capable of adapting their fundraising to rise to the occasion. Museums have successfully gained financial relief from a variety of governmental sources. Where government grants and earned income have fallen short, institutions have increasingly filled the gaps with funding from private donors, corporations, and foundations.
It is clear that diversifying funding sources continues to be an important strategy. The more types of funders an institution approaches, the more likely they are to gain support from different sources, and the more financially stable the museum will be. This idea has long been a part of nonprofit financing, and the pandemic has underscored the importance of a diversified approach. But many museums lack the capacity to pursue a wider pool of funders. This is where partnerships can play an important role. Developing partnerships requires an ongoing investment of time. But they also help organizations pool resources including network connections, staff capacity, and fundraising skills.
When making funding appeals – whether independently or in partnership – children’s museums should consider the value they bring to their community. If a children’s museum were to disappear, what vital services would the community lose? Leaders can reflect on the services their institution uniquely provides. Equally important are the ways that children’s museums complement other community organizations.
Data for this report was collected by an online survey that ACM distributed through an email invitation to children’s museums in the US. The survey was open between September 24 and October 18, 2020. Overall, 96 museums responded to at least part of the survey, and not all museums answered every question in the survey. Researchers kept all responses that met a minimum threshold of questions answered. All participating museums are US-based ACM member institutions, representing 40% of membership. These museums represent all size categories, though only 7 Small museums participated.
Researchers conducted qualitative and quantitative analysis on the survey data. A researcher reviewed open-ended responses from the survey and coded themes in an iterative process to summarize information on partnerships with non-museum organizations. The initial coding process produced a large number of codes, and subsequent coding led to aggregated and more meaningful themes. Responses were consistent across size categories, unless otherwise noted.
AAM & Wilkening Consulting. (2020). National Snapshot of COVID-19 Impact on United States Museums: October 15-18. Retrieved from: https://www.aam-us.org/wp-content/uploads/2020/11/AAMCOVID-19SnapshotSurvey-1.pdf
This project was made possible in part by the Institute of Museum and Library Services. The views, findings, conclusions or recommendations expressed in this publication do not necessarily represent those of the Institute of Museum and Library Services.
The Associations of Children’s Museums (ACM) champions children’s museums worldwide. Follow ACM on Twitter, Facebook, and Instagram. Knology produces practical social science for a better world. Follow Knology on Twitter.
Sharing ACM Trends Reports 4.3 and 4.4 from the Association of Children’s Museums and Knology
ARLINGTON, VA (September 9, 2020)—The Association of Children’s Museums (ACM) and Knology shared Volumes 4.3 and 4.4 of the ACM Trends Reports, “Museums in a Pandemic: Workforce Impacts” and “Museums in a Pandemic: Impacts for Audiences & Partners.” These reports delve into changes affecting children’s museums’ staffing, as well as visitors, members, and partners, in the first two months of the COVID-19 crisis.
“In examining the impacts the COVID-19 on children’s museums, it’s clear the effects of the pandemic will be long-lasting and far-reaching in our field,” said ACM Executive Director Laura Huerta Migus. “In the midst of considerable upheaval, these findings underscore the importance children’s museums have in their communities, both as employers and as providers of services and programming that support children and families.”
The data draws from a survey from 115 ACM member museums conducted in May 2020. Key findings include:
These reports conclude ACM and Knology’s analysis of the impacts of the COVID-19 crisis on the children’s museum field during the first two months of the crisis. ACM and Knology are collecting a second round of data to explore the field’s experiences between May and September 2020. Further impacts will be explored in future reports of the ACM Trends Reports series.
Read the full text of ACM Trends 4.3 here and ACM Trends 4.4 here.
About ACM Trends Reports
Launched in Fall 2017, the ACM Trends Reports series draws from more than a decade of ACM member data to reveal trends in the children’s museum field. Volumes 1-3 are available for free to ACM members and for sale to non-members at www.childrensmuseums.org. This project was made possible in part by the Institute of Museum and Library Services. The views, findings, conclusions or recommendations expressed in this publication do not necessarily represent those of the Institute of Museum and Library Services.
About Association of Children’s Museums (ACM)
The Association of Children’s Museums (ACM) champions children’s museums worldwide. With more than 460 members in 50 states and 19 countries, ACM leverages the collective knowledge of children’s museums through convening, sharing, and dissemination. Learn more at www.childrensmuseums.org.
This post was originally published as ACM Trends Report 4.4, the fourth report in the fourth volume of ACM Trends Reports, produced in partnership between ACM and Knology. Read other reports in this series: ACM Trends Report 4.1, “Snapshots of Impact,” ACM Trends Report 4.2, “Financial Impacts by Mid-May 2020,” and ACM Trends Report 4.3, “Workforce Impacts.”
The ACM Trends Reports team is exploring the effects of the COVID-19 pandemic on children’s museums. By mid-May, museums experimented with strategies and methods for connecting with two groups of stakeholders: audiences and institutional partners. This report describes the outcomes for museums’ work with their members and visitors, as well as new and existing institutional collaborators.
The data is based on responses to a survey conducted in mid-May 2020. Overall, 109 US-based children’s museums and 6 non-US museums were represented in the survey responses. The survey data shows that children’s museums were assessing ways to support their audiences as they: planned to reopen facilities to visitors, produced high quality programming for both members and general audiences, and communicated with these groups. At the same time, half of participating museums also tried to find support for their own institution by developing new or enhancing existing partnerships.
This report is the fourth in an ACM Trends series exploring the early impacts of COVID-19 on the field. ACM Trends Report #4.1 provided a quick snapshot of the early impacts, Trends Report #4.2 described financial impacts, and Trends Report #4.3 explored impacts on the museum workforce. We will continue to monitor the pandemic’s impacts on the field.
By mid-May, children’s museums worked hard to engage two main groups outside of their personnel: their audiences and other organizations.
As of mid-May, children’s museums were testing multiple strategies to serve their audiences, while navigating staffing and financial impacts of the pandemic. These strategies focused on general reopening plans, members, and online offerings.
In the survey, 39% of museums reported a planned date for re-opening their buildings to visitors. Of these, most planned to reopen in summer 2020, and only one planned to reopen in 2021. Museum leaders considered a variety of tactics for operations during reopening, which included timed ticketing, member-only and member-first openings, and augmented safety procedures. However, at this point, most institutions were still in early stages of preparing for reopening and could not yet identify a date. Some directors participating in ACM Leadership Calls asserted that just because state regulations signaled they could reopen, it did not mean they should do so.
Museum leaders identified a range of factors that influenced plans for reopening their facilities to the public. Some cited uncertainty about finances and their capacity to meet cleaning and safety protocols. At this time, museum leaders reported seeing inconsistent guidelines from governing bodies or a lack of official instruction for reopening children’s museums. Some museums surveyed audiences to understand their concerns and interests related to reopening.
By mid-May, most children’s museums were adapting membership policies and plans. Nearly all participating museums (93%) extended renewal dates for memberships. A quarter of museums also expanded the benefits offered for members, such as access to exclusive content and priority admission upon re-opening. Five museums reported providing full or partial refunds for membership dues – of these, an average of 8% of dues were refunded by each institution. Two Large museums donated memberships to essential workers for every new membership purchased.
At the same time, museums invested heavily in providing online content for both members and general audiences. In a review of children’s museums’ websites, we found that 101 out of 109 participating institutions presented online activities on their websites and social media platforms. Two types of programming stood out: over two-thirds of participating children’s museums offered online programs focusing on STEAM, as well as arts and crafts. Just under half of the institutions provided Story Time activities. Other less common programs featured animals or nature, music, and movement or exercise.
All participating institutions offered information on online programming through their websites. Almost all (98%) provided details on their Facebook pages, about 70% presented information on Instagram and Twitter, and about 40% shared on YouTube. Resources were typically presented as either online web resources, downloadable content, or recorded programming. Fourteen of the participating museums offered live virtual programming through Facebook Live, Instagram, Periscope, and YouTube.

Communications
Children’s museums used a variety of communication channels to connect with their members and general audiences. These channels were similar across the two groups, with some small differences that likely depended on typical ways that museums interact with these groups. For members, nearly all museums used email. About three-quarters made social media announcements, and more than half posted announcements on their websites. Meanwhile, for communications with general audiences, museums mostly relied on social media and website announcements, followed by email.
Children’s museums invested in new or updated institutional collaborations to navigate the pandemic. Just over half of participating museums (n = 57) reported establishing new or expanding existing collaborations. Of these, half of the museums partnered on the local level.
Far fewer were state-level or nationally focused, and many didn’t specify the scale of their collaborations.
Museum leaders developed new collaborations or adapted existing ones with the ultimate goal of supporting the institutions as they navigated the crisis. They used several different strategies to accomplish this goal. About a third of participating museums, across all size categories, pursued partnerships to share resources and information, including general best practices, planning, and funding. A quarter of museums focused collaborations on planning specifically related to the pandemic, particularly facility reopening procedures. Another quarter collaborated with goals related to content development, including designing curriculum and program implementation. Other less common objectives included cross-promotions and outreach, advocacy and work around local issues, and collaborative fundraising.
Most frequently, museums of all sizes collaborated with other museums in their cities and towns. They also partnered with other types of organizations, like economic development agencies, local attractions, and other non-profits. Less common collaborations were with schools or education departments, as well as local governments.
During a mass crisis like the COVID-19 pandemic, it may be tempting to narrow an institution’s focus on the “basics” that might seem more easily manageable. However, the definition of children’s museums’ basic services needs to be reexamined. Moreover, the “who” involved in these services should be considered as well.
Museums do not need to weather the pandemic alone. Research across many sectors shows that collaboration strengthens partner organizations and benefits their audiences. As museum leaders examine new ways to pursue their mission of supporting children and families, they should consider themselves as part of the ecosystem of services that meet community needs. This ecosystem will function better when the various parts are coordinating their actions and supporting each other’s work.
The pandemic will continue to unfold, and effects will ripple across the world for years to come. During this process, each community’s needs will evolve.
This crisis has underscored the need for children’s museums to think of themselves as closely linked to other children’s services and programs. Attending to community needs and aspirations can be a shared effort with, for example, schools and other social services groups. Programming can be designed as a complement or extension of offerings that others are providing in their communities. Leaders can ask: What are children’s museums suited to address that schools might struggle to provide? What other new roles might children’s museums fill during this crisis and beyond? Who is in need of support that can be met by the resources of a children’s museum? To answer these questions and more, museum leaders can join or create a collaborative working group to analyze gaps and opportunities in local public education systems and community services. This work not only enhances services for children and families across the community, but also reduces overlap in different organizations’ work.
In a similar vein, this crisis can help children’s museums identify new partnerships with organizations that have historically gone their own way. Public libraries and soup kitchens in particular might be effective partners for museums to pursue their mission of supporting children and families. These partnerships can also help museums make strong appeals to funders.
When museums are able to invest in partnerships, consider how to approach communications with new and existing audiences. It may be that social media, email, and website announcements don’t work well for new audiences, particularly if they lack consistent access to internet. Collaborations may also be a good opportunity for sharing communication responsibilities across organizations. Partners may have different communication strengths and preferences, which museums can tap into as they offer their own preferred methods.
Data for this report was collected by an online survey distributed by ACM through an email invitation to children’s museums worldwide. The survey was open between May 7 and 18, 2020. Overall, 109 US-based children’s museums and 6 non-US museums contributed to the dataset. All participating US museums were currently ACM member institutions, representing 36% of membership. Participating museums were roughly representative of all size categories.
The information about types of online programming was collected in a manual review of websites and social media for the children’s museums that participated in the survey. ACM staff coded the types of programs based on common themes and refined the themes into meaningful categories. ACM staff also provided information about museum leaders’ considerations related to reopening facilities to the public.
Figure 1 shows average responses to questions about methods used to communicate with members and visitors. Responses were consistent across size categories, unless otherwise noted.
A researcher reviewed open-ended responses from the survey and coded themes in an iterative process to summarize information on partnerships. The initial coding process produced a large number of codes, and subsequent coding led to aggregated and more meaningful themes.
This project was made possible in part by the Institute of Museum and Library Services. The views, findings, conclusions or recommendations expressed in this publication do not necessarily represent those of the Institute of Museum and Library Services.
The Associations of Children’s Museums (ACM) champions children’s museums worldwide. Follow ACM on Twitter, Facebook, and Instagram. Knology produces practical social science for a better world. Follow Knology on Twitter.
This post was originally published as ACM Trends Report 4.3, the third report in the fourth volume of ACM Trends Reports, produced in partnership between ACM and Knology. Read other reports in this series: ACM Trends Report 4.1, “Snapshots of Impact,” ACM Trends Report 4.2, “Financial Impacts by Mid-May 2020,” and ACM Trends Report 4.4, “Impacts for Audiences and Partners.”
The ACM Trends Reports team is exploring the effects of the COVID-19 pandemic on children’s museums. By mid-May, many museums had adjusted aspects of their staffing to navigate the early implications of the unfolding situation. This report describes effects related to full-time and part-time staff, as well as volunteers, and implications for the children’s museums workforce.
The data comes from responses to a special survey conducted in mid-May 2020. Overall, 109 US-based children’s museums and 6 non-US museums were represented in the survey responses. We found that, at that point, most full- time employees had either no change to their employment or reduced hours, whereas most part-time employees were laid off or furloughed. Museums communicated in different ways and to varying extents with volunteers and staff that had been laid off or furloughed. The findings offer opportunities for children’s museums to reflect on staffing decisions, as well as their communication styles and goals.
This report is the third in Volume 4 of the ACM Trends Report series, which studies the early impacts of COVID-19 on the field. ACM Trends Report #4.1 provided a quick snapshot of the early impacts, and Trends Report #4.2 described financial impacts. Trends Report #4.4 will explore early impacts on visitors, members, and partners. We will continue to monitor the pandemic’s impacts on the field over time.
The children’s museums’ workforce is critical to the operation of institutions and the success of the field. We explored this idea in ACM Trends Report #1.10, which showed that, on average in 2016, 76% of children’s museum personnel consisted of volunteers, 16% were part-time staff, and 8% were full-time staff. On average, each of these groups devote different amounts of time to working at children’s museums, with full-time staff contributing the highest number of hours. The following findings focus on US museums unless otherwise noted.
The May 2020 survey showed that children’s museums made staffing adjustments in response to the pandemic, which affected workers in different ways. Figure 1 shows that, on average, full-time employees were the least likely to be dramatically affected by staffing changes, with over two-thirds having hours reduced or no changes to their employment. However, about 80% of part-time staff were furloughed or laid off. Overall, 36% of participating children’s museums laid off or furloughed staff. By comparison, 44% of museums of all types said they laid off or furloughed staff in a June survey (AAM, 2020).
The actions taken by children’s museums varied greatly, with some laying off or furloughing almost all their staff while others made few changes. The averages were generally consistent across size categories, though Small museums were the least likely to cut full-time staff. When we compare the financial impacts described in ACM Trends Report #4.2 to staffing impacts, there is no reliable relationship between relief funding received or the size of the museum to the proportion of staff laid off or furloughed. This suggests that the decision to change staffing appears to depend on the conditions surrounding each museum.
Two factors may have influenced these conditions. First, the Small Business Administration was in the process of disbursing Paycheck Protection Program funds around the time of this survey. (ACM Trends Report #4.2 showed that these funds were the most commonly received among children’s museums.) Museums that had recently received relief funds may not have made rehiring decisions by the time of the survey. Second, some leaders reported in ACM Leadership Calls that they made decisions about layoffs and furloughs based on whether they anticipated their part-time staff would receive unemployment benefits; in these cases, museums tried to prioritize their full-time staff as they planned how to use relief funding.
Staffing and operations decisions today seem to match historical patterns in museum hiring, and may have lasting negative impacts for children’s museums and the broader museum field. Media reports suggest that museum layoffs and furloughs are most likely to first affect lower paid floor or frontline staff, including visitor services workers and educators. These positions also tend to be filled by museums’ most racially and ethnically diverse professionals. Widescale layoffs of these individuals may affect perceptions of a museum’s concern for staff, as well as affect the field’s ability to attract talent in the future.
As the shape of day-to-day business has evolved, most participating children’s museums (n = 80) reported experimenting with reassigning personnel to new roles and duties by mid-May. As museums reopen throughout the summer, these reassignments are evolving and will be reported on in future reports.
For half of respondents, the majority of these reassignments focused on two connected responsibilities. First, staff reassigned to programming have produced and delivered new learning and experiential content, including videos. Second, reassigned personnel have also focused on creating online content for websites and social media.
The next most common duty for reassigned personnel was operations, though it was far less common than programming and online content. Staff reassigned to operations worked on fundraising, accounting, general administration, and management.
Some children’s museums – primarily Medium and Large organizations (n = 5 and 13, respectively) – looked outside of their staff to contract services for their institution and personnel. The most common reason for these services was to obtain legal advice. Other services were related to human resources, as well as physical and mental health services. Museums outside of the US also reported using these contract services.
Many museums kept lines of communication open with laid off and furloughed staff as well as volunteers. Of the 75 institutions that laid off or furloughed staff, 59 institutions explained the goal of their ongoing communications with personnel. About half of these museums, across all sizes, used communications to provide general museum updates, which focused on the institution’s status, leaders’ decision-making, reopening plans, and funding status. A third indicated their goal was
to discuss future staffing plans, including updates on when they plan to rehire or revise staffing structures. Roughly a fourth said their goal was to sustain engagement with staff, using check-ins to convey both the museum’s interest in their return to work, and the value of personnel to the museum. Three museums, one in each size category, indicated that they sought to provide emotional support to laid off and furloughed staff in their communications.
When communicating with volunteers, the most common goals were to continue engagement and provide updates about the museum.

We also asked museums about the communication methods they use and how often; this information adds nuance to the reasons for communication decisions.
Figure 2 shows the ways that children’s museums communicated with personnel whose work had been substantially altered by mid-May, particularly staff who were laid off or furloughed as well as volunteers.
Of the 75 institutions that laid off or furloughed staff, 65 were communicating with those individuals. The most common method of communication, for two-thirds of museums, was to use personal email accounts and about half through text messages. To a lesser extent, they also used telephone and video calls.
Participating museums communicated less with volunteers. Only 54 of the 109 participating museums indicated that they communicated with volunteers at all. Telephone calls and personal emails were used by half of the 54 museums that responded, with the third most popular method being the use of institutional email accounts. At the time of the survey, nine institutions had no contact of any type with personnel whose work had been impacted by the pandemic.
Decisions about personnel may be among the most important and complex issues that children’s museums navigate during the pandemic. The early data from May 2020 show there are opportunities for supporting staff and volunteers in ways that benefit both museums and workers throughout the crisis.
The survey data suggest many museums may be missing a chance to engage their volunteers, a group that makes up the largest portion of personnel at children’s museums. There may be tasks that volunteers can do at home, particularly in support of the personnel who have been reassigned to producing programming and online content. Even if volunteers cannot be engaged in the work of the museum right now, regular communications can help reinforce their value to the organization. By mid-May, most of children’s museums’ full-time staff were employed, even though some had reduced hours. Part-time staff, however, were much more widely affected by layoffs and furloughs. There is potential for these changes to undermine museums’ efforts to work towards diversity and inclusion in their workforce. As leaders weigh future personnel changes, they should consider how to proactively address and support groups disproportionately impacted by the pandemic as part of their efforts to meet the needs of their communities.
These early data suggest that museum leadership should carefully consider how to use workforce communications strategies to lay the foundation for recovery. Supportive messaging with museums’ community of staff and volunteers can not only deliver on their mission, but also strengthen equity throughout the pandemic.
Data for this report was collected by an online survey distributed by ACM through an email invitation to children’s museums worldwide. The survey was open between May 7 and 18, 2020. Overall, 109 US-based children’s museums and 6 non-US museums contributed to the dataset. All participating US museums were currently ACM member institutions, representing 36% of membership. Participating museums were roughly representative of all size types.
Figures 1 and 2 show average responses to questions about status of staff, and methods used to communicate with staff and volunteers. Responses were consistent across size categories, unless otherwise noted. For Figure 1, we asked museums about the proportions of staff that had been furloughed, laid off, reduced hours, and kept at their normal hours. Proportions were required to sum to 100%.
A researcher reviewed open-ended responses from the survey and coded themes in an iterative process to summarize data on reassigned duties, roles, and services, as well as goals of communications with cut staff and volunteers. The initial coding process produced a large number of codes, and subsequent coding led to aggregated and more meaningful themes.
American Alliance of Museums. (2020). A Snapshot of US Museums’ Response to the COVID-19 Pandemic. https://www.aam- us.org/2020/07/22/a-snapshot-of-us-museums-response-to-the-covid-19- pandemic/
This project was made possible in part by the Institute of Museum and Library Services. The views, findings, conclusions or recommendations expressed in this publication do not necessarily represent those of the Institute of Museum and Library Services.
The Associations of Children’s Museums (ACM) champions children’s museums worldwide. Follow ACM on Twitter, Facebook, and Instagram. Knology produces practical social science for a better world. Follow Knology on Twitter.
This post was originally published as ACM Trends Report 4.2, the second report in the fourth volume of ACM Trends Reports, produced in partnership between ACM and Knology. Read other reports in this series: ACM Trends Report 4.1, “Snapshots of Impact,” ACM Trends Report 4.3, “Workforce Impacts,” and ACM Trends Report 4.4, “Impacts for Audiences and Partners.”
In March 2020, it became clear that the COVID-19 pandemic would have a deep and lasting impact on the museum field. The ACM Trends Reports team investigated the effects on children’s museums with a special survey in mid-May 2020. Overall, 109 US-based children’s museums and six non-US museums were represented in the survey responses.
The data provides a snapshot of the field in the early stages of navigating financial sustainability in the face of a global crisis. We compared the COVID- 19 survey data to information we’ve collected in the past about museum size – specifically, 2016 institutional data adjusted for inflation. This Trends Report can inform the steps that museum leaders take as the effects of the pandemic continue to ripple across systems and people that make up the field. In particular, this information can help leaders advocate for support from funders and policymakers. Future reports in this volume will examine other topics, such as staffing and engagement with audiences.
This Trends Report shows that relief funding through the US Small Business Administration’s Paycheck Protection Program (PPP) was an essential support tool for children’s museums early in the pandemic. Overall, PPP and other relief funds helped cover the majority of Small museums’ general expenses. Medium museums, on the other hand, were able to cover a much smaller portion of their overall expenses with relief funds, and will require other sources of funding. Large museums did somewhat better than Medium institutions but still need additional support, with reported funding covering about half of overall expenses.

Overall, museums most commonly applied for and received funds from the Paycheck Protection Program. Of the 109 children’s museums participating in the survey, 101 requested PPP funding and 95 received it. At the time of the survey, this funding program was designed to keep employees on the payroll for eight weeks, and could be used for payroll, rent, mortgage interest, or utilities. Another program of the US Small Business Administration, the Economic Injury Disaster Loan (EIDL) program, provided loans and advances to 22 participating children’s museums, out of 39 that requested these funds. There have been reports of delays in processing EIDL applications, which may explain the gap between requested and awarded funds.
Private foundations proved to be a substantial source of relief funding for children’s museums. Half of the participating museums (n = 55) applied to private foundations for funds, and 34 received support. Three children’s museums outside of the US reported applying for and receiving funding from private sources.
About one-third of participating children’s museums applied for funding from state arts and humanities councils, which received funds from the National Endowment for the Arts and the National Endowment for the Humanities through the CARES Act. At the time of the survey, many of these grants had not yet been awarded.
Participating museums also reported experimenting with other forms of financial relief fundraising. These strategies appeared to vary across size categories. Medium and
Large museums most commonly sought donations through appeals to corporate funders, members, boards, and other sources. These institutions also described creating fundraising events and activities like galas and fund drives, as well as online campaigns. Some institutions, primarily Medium museums, also tried to generate revenue through selling products (e.g., online gift shops). Small museums tried to raise money through donations and revising their existing funds. Medium and Large museums revised existing funds as well, which included accelerating annual gifts, reallocating funds, and tapping into reserve funds. Seventeen museums, across all sizes, reported doing Giving Tuesday Now campaigns. Two museums indicated they were using their physical space to generate supplemental revenue. As some museums tried to raise funds, others engaged in fiscally conservative strategies such as postponing capital projects and cutting non-essential spending. Some reorganized staffing, which we’ll examine in a future ACM Trends Report.
Of the 109 surveyed museums, only one Large museum received financial support from insurance, under a disaster relief policy.
Museum size predicted the amount of funding received, as well as the proportion of expenses covered by that funding. Relief funds appeared to be commensurate with the size of participating children’s museums, with Small museums receiving the smallest amounts, and so on.
However, there’s a different story when we compare the amount of relief funds to the proportion of expenses that those funds could potentially cover.
According to Table 1, Small museums were most likely to have a majority of their expenses offset by relief funds.
Medium museums had the lowest rate of offsetting expenses with relief funds, with only 36% of quarterly overall expenses covered. Large museums did somewhat better, with 45% of their quarterly general expenses offset by relief funds.

We assessed how relief funding for the children’s museums field compared to national statistics for the leisure industry. As of the time of the survey in May 2020, PPP funding was the most commonly received financial relief. At that point in time, the Small Business Administration had provided a total of $7.6B to the arts, entertainment, and recreation industry, of which museums are a part (Small Business Administration, 2020). The average institution in this industry received $73,100 in PPP loans. Children’s museums participating in the survey had received a comparable amount, with an average of $78,750 in PPP relief funds.
As the pandemic continues to shift the landscape, children’s museums will need to fundraise and experiment with new funding sources. Two federal sources were generally supportive to the field – PPP and EIDL – and private funds provided a substantial amount of support as of mid-May. We anticipate that other sources will prove useful to children’s museums as we continue to monitor financial impacts of the pandemic.
Some museums have been successful with attempts to increase revenue through selling products, using their facilities for novel purposes, and collaborations. These approaches may become more important as time goes on, and institutions might consider new ways of meeting their stakeholders’ needs. While this work may not always build revenue, it will support children’s museums’ missions of service to their communities and may help them make the case for new funding from other sources.
Leaders should take their institution’s size into account when they consider how and where to fundraise. Medium and Large museums can appeal to funders by highlighting the lack of coverage for expenses in early rounds of funding.
Data for this report was collected by an online survey distributed by ACM through an email invitation to children’s museums worldwide. The survey was open between May 7 and 18, 2020. Overall, 109 US-based children’s museums and six non-US museums contributed to the dataset. All participating US museums were currently ACM member institutions, representing 36% of membership.
Our analysis used the size categories of Small, Medium, Large, which were originally presented in ACM Trends Reports #1.1 and #1.7. We use these categories to frame our analysis for many reports in the ACM Trends series because institutional size predicts a range of outcomes for children’s museums. Participating museums in the May 2020 survey were roughly representative of the size categories.
The survey asked about a range of relief funding sources that children’s museums had pursued. Figure 1 presents the current results for those sources that had disbursed funds at the time of the survey. We will continue to track this information over time.
For the information about experimenting with funding, a researcher reviewed open-ended responses from the survey and coded themes in an iterative process to summarize the data. The initial coding process produced a large number of codes, and subsequent coding led to aggregated and more meaningful themes related to new approaches to fundraising.
For Table 1, we combined all types of funding, even though some funds had restrictions on how they could be used. The survey did not seek detail on restrictions, so a combined approach provided a general sense of the funding received, compared to the expenses that could be offset. Median quarterly expenses for each museum size were taken from 2016 ACM data and adjusted for inflation.
U.S. Small Business Administration. (2020). Paycheck Protection Program (PPP) Report: Approvals through 5/30/2020. U.S. Small Business Administration. https://www.sba.gov/sites/default/files/2020-06/PPP_Report_200530-508.pdf
This project was made possible in part by the Institute of Museum and Library Services. The views, findings, conclusions or recommendations expressed in this publication do not necessarily represent those of the Institute of Museum and Library Services.
The Associations of Children’s Museums (ACM) champions children’s museums worldwide. Follow ACM on Twitter, Facebook, and Instagram. Knology produces practical social science for a better world. Follow Knology on Twitter.
This post was originally published as ACM Trends Report 4.1, the first report in the fourth volume of ACM Trends Reports, produced in partnership between ACM and Knology. Read other reports in this series: ACM Trends Report 4.2, “Financial Impacts by Mid-May 2020,” ACM Trends Report 4.3, “Workforce Impacts,” and ACM Trends Report 4.4, “Impacts for Audiences and Partners.”

To understand how the COVID-19 pandemic is affecting the children’s museum field, we surveyed ACM member institutions from May 7 to 18, 2020 about their experiences. Overall, 109 US-based children’s museums and 6 non-US museums were represented in the responses. Here are several initial findings; future reports will provide more detail.
This project was made possible in part by the Institute of Museum and Library Services. The views, findings, conclusions or recommendations expressed in this publication do not necessarily represent those of the Institute of Museum and Library Services.
The Associations of Children’s Museums (ACM) champions children’s museums worldwide. Follow ACM on Twitter, Facebook, and Instagram. Knology produces practical social science for a better world. Follow Knology on Twitter.
We have completed the first volume of the ACM Trends Reports! As we reflect back on our inaugural volume, we would like to discuss some key highlights the reports have unveiled that are relevant to both ACM and the field. (For those who have not read the reports, we are hoping this will inspire you to give them a read! Find out more here.)
The ACM Trends Reports are possible through a partnership with New Knowledge Organization, LTD (NKO). Collaborating with NKO allows ACM to produce concise, readable reports about trends identified through analysis of a decade of ACM museum member data. Prior to the Trends Reports, ACM provided reports to members based on data collected from the most recent museum membership survey, conducted every two years. These bi-annual reports serve an important purpose—and are not going away! However, they only focus on membership data from one survey year—and therefore lack the contextual references around museum operations and programming.
Why are the Trends Reports important? First, by looking at more than a decade of ACM membership data, these reports share trends in the operational, financial, and programmatic work of the children’s museum field. They also allow ACM to identify areas of strength in the field, such as where museums effectively provide services or efficiently use funding, as well as areas for improvement. By identifying these trends, ACM can work to provide more effective professional development opportunities for members. These trends, backed by data, also allow ACM to have substantive conversations with policymakers and national partners on the strengths of the field.
How do the Trends Reports benefit my museum? One of the most important results from the first volume of Trends Reports was the creation of the expanded size framework. This framework allows museums to identify as small, medium, or large based on four criteria: Total Operating Expenses, Total Staff, Total Square Footage, and Total Annual Attendance. The first four reports in Volume 1 discusses the creation of the size framework, as well as effective programming and operational approaches from the perspective of each size category. The size framework has been used in ACM’s updated Query Reports Service and the ACM 2016 Membership Survey Report (the most recent bi-annual report, mentioned earlier). The framework also provided the structure for a series of investigation sessions at InterActivity 2018 (Birds of a Feather Small, Medium and Large). In short, the updated size framework provides a more concise tool for museums to use in benchmarking (or planning) and in highlight their ongoing work.
| Size Category | Total Operating Expenses | Building Size |
Annual Attendance |
Staff |
| Small | Less than $487,326 | Less than 12,000 | Less than 50,000 | Less than 14 |
| Medium | $487,326 – $2.3 million | 12,000 – 44,040 | 50,000 – 148,667 | 14 – 41 |
| Large | More than $2.3 million | More than 44,040 | More than 148,667 | More than 41 |
How do the reports provide context for the work of children’s museums? The remaining reports in Volume 1 focused on several trends revealed from the longitudinal data analysis. Some trend topics include museums and nontraditional families, the children’s museum workforce, and operating income and expenses.
These latter reports place children’s museum trends in a larger context by referencing data sources outside the children’s museum field. For instance, ACM Trends Report 1.6: Reaching Nontraditional Families discusses how ACM Museum Membership data showed how children’s museums engage underserved populations, using correlating data from Children’s Bureau and Children’s Defense Fund. ACM Trends Report 1.10: Making a Museum Sing: the Children’s Museum Workforce discusses the different types of labor in children’s museums: full-time, part-time, and volunteer, drawing from data shared in the ACM Member Survey, the 2016 ASTC-ACM Workforce Survey, as well as Bureau of Labor Statistics. These additional data sources place the children’s museum workforce data beyond the children’s museum field and provide contextual data in order to expand the conversation to outside stakeholders. In essence, the ACM Trends Reports have provided members a concise way to discuss data driven trends about children’s museums to a broad audience.
Caveat: the data behind the ACM Trends Reports is US-centered. The ACM Museum Membership Survey data almost entirely focuses on responses from US museums, particularly the workforce and financial data. In addition, most additional data sources are from US government agencies or US nonprofits. This is partly due to data access, ACM is able to access most US museum financial data via 990 Forms or Guidestar, whereas non-US financial data is more difficult to obtain.
How have the reports been used? During the development of the first volume, ACM and NKO created opportunities to receive feedback from member museums via surveys, webinars and a brown bag lunch at InterActivity 2017. As a result, many indicated that the reports would be helpful in describing the work of children’s museum to stakeholders such as board members, families, and community partners. Others also recognized the reports as being useful to funders and for planning purposes. Some also identified the reports as being useful in onboarding new staff, particularly professionals new to the children’s museum field.
What’s next for the ACM Trends Reports? Next week, ACM will release Volume 2 of the ACM Trends Reports, all about the economic impact of children’s museums! Stay tuned for more information.
Jen Rehkamp is Director, Field Services at the Associations of Children’s Museums (ACM). Follow ACM on Twitter, Facebook, and Instagram.
In June 2017, ACM partnered with New Knowledge Organization to release the first six ACM Trends Reports. This first volume, which will consist of 12 reports total, draws from a decade of ACM member data, including survey responses from 2004-2012. This is the first time ACM has been able to look at a decade’s worth of membership data in order to identify trends to better understand our field, and we are very excited to share the results with you.
On July 25, I joined New Knowledge’s John Fraser, PhD, AIA and Nicole LaMarca in hosting a webinar to introduce the reports and answer questions. (Download the recording here.) This provided us an opportunity to ask attendees about the issues they’d like to see explored in future ACM Trends Reports. The webinar followed up on a Brown Bag discussion about the reports held at ACM’s annual conference, InterActivity 2017.
More than 60 people joined the webinar to learn more and share their thoughts. Here are some of the top subjects that came up:
Q) How can I use the reports?
A) These reports are designed to be shared. With most reports just four pages long, they can be read as independent standalone pieces or as a complete series.
Reports can be shared with key stakeholders, such as funders, board members, new staff, families, and community partners. The series can also be used for planning. For instance, they can be used to identify key metrics, refine business models, conduct evaluation, and supplement professional development.
At the InterActivity 2017 Brown Bag, attendees were most excited about sharing the reports with funders, while the webinar attendees preferred planning.
Q) What are some future topics for ACM Trends Reports?
A) Based on our discussion during the Brown Bag lunch, some of the top topics are:
Demographics: Who’s coming to the museum? What’s the frequency of member visits and what are the ages of children? What are the ages of visitors broken out by free choice attendance vs. service and school programs?
Staffing: What are the latest trends in hiring, such as how our field is working to increase diversity? What are our dominant staffing business models?
Finances: What are our museums’ economic impact on their communities? How are we dealing with issues of gentrification and community turnaround? What are the pros and cons of different locations? What do we find when we do a budget breakdown by size, and how do budgets change as institutions grow?
Partnerships, collaborations, and expansions: What are the dominant social service organizations that children’s museums work with in every community? How costly is it to renovate or fund an emerging space? How do libraries create museums or learning spaces? How many children’s museums have preschools, head start programs, or charter schools?
From responses to the webinar, we gained several new leads on other topics to cover. Here’s a word cloud of the topics that came up the most in the chat box that attendees participated in:
Q) How do you plan to incorporate data from the 2016 ACM Membership Survey?
A) Data from ACM’s 2016 Membership Survey will be made available this fall. Incorporating the 2016 data will allow for updates to the museum size categories in forthcoming ACM Trends Reports. The size categories are currently drawing from ACM’s 2010 membership data, because this is the richest sample out of the membership survey responses between 2004-2012. For instance, Total Operating Expenses is one criterion that defines museum sizes in the reports, and we will use the 2016 data to update the expense figures in this criterion.
We will also be incorporating the 2016 data in our future trends analysis, to determine what’s happening in museums by size; for instance, how different sizes influence staffing distribution or budget.
Q) How will data be analyzed in future reports?
A) There are many methods we can use to talk about trends. We want to use the method that makes the most sense to answer the questions you feel are important.
Exploring complex questions, such as staffing and retention, may require qualitative case studies or facilitated discussions. ACM and New Knowledge aren’t tied to quantitative analysis of numbers for every report. For example, we’re open to facilitating conversations that can turn into a case-study style Trends Report.
We want to hear from you! Are there any topics that you care about that you think should be covered in future ACM Trends Reports?
Jen Rehkamp is Director, Field Services at the Associations of Children’s Museums (ACM). Follow ACM on Twitter, Facebook, and Instagram.
 What stories and trends do a decade of ACM member data reveal?
To find out, ACM has partnered with New Knowledge Organization Ltd. (NKO) to launch a series of 12 trends reports about the children’s museum field.
The ACM Trends Reports series analyzes 10 years of ACM member data to highlight emerging issues and identify opportunities for advancement. These reports are…
All 12 reports will be provided as PDFs. You can order your reports here individually or as a subscription. Six are available now:
| Pricing: ACM Trends Reports Subscription* Members: $100 Summer Discount: $50 Nonmembers: $150 |
ACM Trends Reports Single Report Members: $10 Summer Discount: $5 Nonmembers: $15 |
*The remaining 6 reports will be distributed monthly throughout the rest of the year.
Want to learn more about the ACM Trends Reports? Join ACM for a webinar on Tuesday, July 25th from 2 p.m.-3 p.m. EDT to discuss the development of the reports and learn how the reports apply to your strategic goals.