July 26, 2021 / News & Blog
| This post was originally published as ACM Trends Report 4.12, the twelfth report in the fourth volume of ACM Trends Reports, produced in partnership between ACM and Knology. |
Since May 2020, the ACM Trends Report team has tracked the impacts of the pandemic on children’s museums and the field’s innovations during this time, through survey studies and data gathered through ACM’s Museums Mobilize initiative. ACM member museums completed surveys in spring 2020, fall 2020, and spring 2021, as well as participated in discussion and reflection on a regular basis.
This ACM Trends Report presents new data on museum personnel from 91 museums that participated in the spring 2021 survey, compared to previous data measuring changes in personnel throughout the pandemic. The pandemic has affected museum personnel of all types, from full-time and part-time workers to contractors and volunteers. In particular, the status of part-time workers dramatically changed over time. Museums estimated that, on average, about a quarter of part-time employees remained at their pre-pandemic capacity by spring 2021. Meanwhile, about half of full-time workers were at their normal capacity by that time. Children’s museums decreased volunteers and contractors’ work as well. As we’ve seen in previous reporting, museums and their teams creatively transformed personnel roles and responsibilities over the course of the pandemic.
There are signs that museums are beginning to rebuild their teams. About half reported they were in the process of rehiring both full-time and part-time staff. Rebuilding the workforce will be an important part of reimagining how children’s museums serve their communities.
Children’s museums are operated by a mix of personnel types. In a 2018 analysis, children’s museums’ teams were composed of an average of 8% full-time workers, 16% part-time staff, and 76% volunteers, in addition to contractors. However, each group worked very different hours, with full-time staff annually averaging about 2,000 hours, part-time staff about 1,000 hours, and volunteers about 150 hours (Flinner et al., 2016; Bureau of Labor Statistics, 2017). The COVID-19 pandemic shifted the landscape for children’s museum personnel.
Since the beginning of the pandemic, children’s museums navigated financial shortfalls by laying off, furloughing, or reducing hours for their full-time and part-time workers. Over the course of the past year, institutions were more likely to keep full-time employees staffed at their normal capacity, compared to part-time staff’s typical levels.
During this period, retention rates for part-time staff were roughly half that of full-time workers.
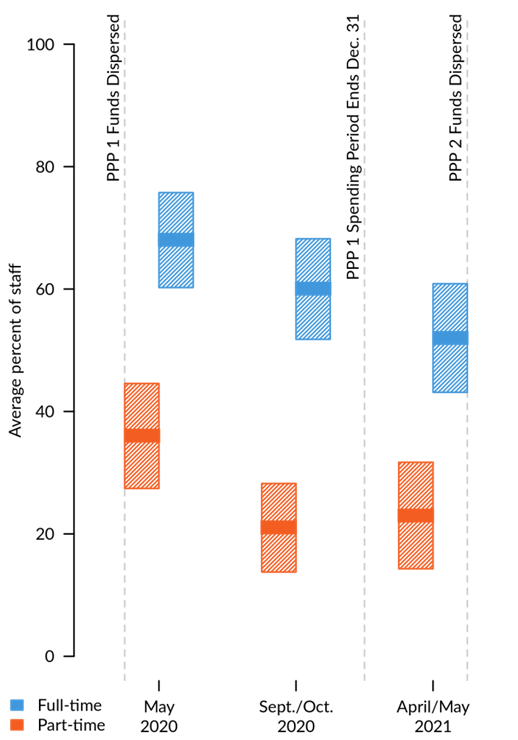
Figure 1. Percentage of staff whose employment status remained normal during the pandemic, as estimated by museums.
Figure 1 illustrates the changes that took place in staffing at three points in time: spring 2020, fall 2020, and spring 2021. Let’s walk through how to read this chart, which visualizes statistics known as confidence intervals. The solid center marks indicate the average percentage of staff with no changes to their employment status at each point in time. These percentages were estimated by the museums and were not precise counts. Since not all ACM members participated in the survey, there is a degree of uncertainty in the averages. The chart indicates this uncertainty with the shaded boxes that surround the solid marks, also called ranges. We calculated that 95% of museums’ estimates on staffing would fall within the shaded boxes. The more museums that respond, the more accurate and tighter the ranges would be.
Let’s also discuss how to interpret the significance of the changes over time in Figure 1. A “significant change” means that the shift is not simply due to chance – in other words, there is a high probability that there is indeed a shift in the thing being measured. In this chart, we can detect significant changes by looking at a center mark at one point in time and comparing it to the range at another point in time. If there is overlap, the change might be due to chance. But if the center mark does not overlap with the range at another point in time, then the change is likely meaningful. In Figure 1, for instance, the change in estimates of full-time staff retention is not significant from spring 2020 to fall 2020, whereas it is from spring 2020 to spring 2021.
There are several things that likely influenced museums’ capacity to retain staff since the beginning of the pandemic. Most children’s museums received support from the first round of the Paycheck Protection Program (PPP 1) offered by the Small Business Administration (SBA) in spring 2020. PPP 1 funds came with stringent requirements for staffing and payroll in spring 2020, but these conditions eased by the time of the second survey in fall 2020. Museums had to fulfill PPP 1 spending requirements by December 31, 2020.
The SBA was in the process of allocating the second round of PPP funding (PPP 2) at the time of the spring 2021 survey. Fewer children’s museums applied for PPP 2 funds, but success rates were still high. These funds have the same more relaxed requirements relating to staffing and payroll as were used in PPP 1. However, it seems museums continued to struggle to keep both full-time and part-time workers employed at their pre-pandemic levels.
There may be other factors affecting staffing and hiring. Museums increasingly opened their doors to in-person audiences when infection rates were falling and vaccination rates were rising across states. In early 2021, some states started to pull back unemployment benefits that had been expanded at the beginning of the pandemic. This shift may also have affected hiring for some children’s museums.
In 2016, Small and Medium museums worked with an average of 36 volunteers, and Large museums worked with an average of 380 volunteers (Flinner et al., 2018). By spring 2021, less than half of the 69 responding institutions reported working with volunteers. Before the pandemic, museums tended to recruit volunteers from all age groups, beginning with 15 to 17-year-olds through people age 55 and up. Those working with volunteers in spring 2021 continued to recruit from a wide range of age groups, except for ages 15 to 17.
Prior to the pandemic, volunteers served primarily by interacting with visitors. These visitor-facing roles consisted of facilitating exhibits, programs, and events. In the past year, museums have reduced volunteers’ work in this area, though it remains the most common task via virtual and online platforms. Nine museums reported reassigning volunteers to creating kits or packets for distribution to community members. Prior to the pandemic, volunteers also supported administration and operations, such as preparing materials, stocking supplies, cleaning, and maintaining collections. Museums reduced these types of volunteer tasks during the pandemic.
In spring 2020, nearly all museums working with contractors laid off some or all of these workers. By spring 2021, nearly all museums that staffed contractors before the pandemic had resumed working with this category of personnel. Eight museums that had not hired contractors before the pandemic reported doing so over the last year. These institutions primarily hired contractors for operations and administrative support.
Out of 69 museums that provided information about contractors, about two-thirds reported using contractors’ services both before and during the pandemic. Exhibits and programming was the most common area for contractors’ work before the pandemic, while operations and administrative support was the most common contractor role during the pandemic. There were fewer museums that continued to work with contractors on facility maintenance and exhibits and programming during the pandemic, compared to their pre-pandemic rates.
More museums reported working with IT and web services contractors during the pandemic compared to their pre-pandemic practices, though fewer than half of participating institutions did so.
Museums are in the early stages of rebuilding their teams through hiring. Sixty-nine museums specified their current status on hiring different types of staff. Half were rehiring
both full-time staff and part-time staff. Of these institutions, most looked to hire new employees, and about half also recruited from staff who had been furloughed or laid off during the pandemic. Some museums may also be bringing volunteers and contractors on board instead of or in addition to hiring part-time and full-time workers.
We anticipate that museums’ efforts to rebuild their teams will increase in the next few months. Institutions will continue to re-open for in-person activities and PPP 2 funds will be fully distributed. Vaccination rates may increase across the country, which will make the workplace safer. Meanwhile, states may continue to restrict unemployment benefits, which could encourage more people to return to work.
The past year has seen museums reimagine their operations and service to their communities. To continue on this path, children’s museums must also rebuild their personnel. What roles can be reshaped? Which skills might a team possess that the museum has not yet tapped into? How can the museum fill the gaps in skills and experience – through training, new hires, or learning with and from peer institutions? Many museums will need the support of funders and stakeholders to access the resources to rebuild teams. We can look to the 2018 Trends Report series on economic impact for guidance on how to articulate the value of children’s museums as economic engines in their communities. This research found that children’s museums supported 57,000 jobs in the US, of which 41% are outside of their walls. For every full-time position within a museum, the institution supported nearly 1½ external jobs through spending on vendors and employees’ spending. Museums’ spending supports specific industries, typically health and social services, retail, real estate, and hospitality, though there are differences across regions (Voiklis, Fraser, et al. 2018; Voiklis, Flinner, et al., 2018). Leaders can use these statistics, along with data from their own institution, to make the case for gaining support for their rebuilding process.
The data used in this report came from an online survey that ACM sent to US-based children’s museums. Overall, 91 museums responded to at least part of the survey. All participating museums were based in the US.
Bureau of Labor Statistics. (2017). American Time Use Survey – 2016 Results. Washington, D.C.: U.S. Department of Labor. https://www.bls.gov/news.release/pdf/atus.pdf. Accessed December 13, 2017.
Flinner, K. Fraser, J., & Voiklis, J. (2018). Making a Museum Sing: the Children’s Museums Workforce. ACM Trends 1(10). New York: Knology & Association of Children’s Museums.
Voiklis, J., Flinner, K., & Fraser, J. (2018). The Economic Impact of Children’s Museums: Our Jobs, Their Jobs, All Jobs. ACM Trends 2(2). New York: Knology & Association of Children’s Museums.
Voiklis, J., Fraser, J., & Flinner, K. (2018). The Economic Impact of Children’s Museums: The Ripple Effect of Spending. ACM Trends 2(1). New York: Knology & Association of Children’s Museums.
This project was made possible in part by the Institute of Museum and Library Services. The views, findings, conclusions or recommendations expressed in this publication do not necessarily represent those of the Institute of Museum and Library Services.
The Associations of Children’s Museums (ACM) champions children’s museums worldwide. Follow ACM on Twitter, Facebook, and Instagram. Knology produces practical social science for a better world. Follow Knology on Twitter.