November 3, 2022 / News & Blog
| This post was originally published as ACM Trends Report 6.1, the first report in the sixth volume of ACM Trends Reports, produced in partnership between ACM and Knology. |
Members are the lifeblood of many children’s museums. They are loyal patrons who trust museums to provide playful learning opportunities for their children, often complementing trips to the zoo or aquarium. But when children “age out,” families may turn to other cultural institutions and start to reconsider the value of their membership. Understanding value seekers’ calculations can help children’s museums cultivate trust through transparency.
In this Trends report, we look at what membership pricing and attendance data can tell us about children’s museums. We focus on what museums might want to think about when attempting to stabilize their membership base, and on how to forge trusting relationships with prospective members.
National data related to membership pricing has been of particular interest to the ACM leadership community in recent years, especially as it relates to post-pandemic operations. Prompted by a specific request from an ACM member, this report contributes to these ongoing discussions. We used data from the Spring 2022 targeted ACM member survey and collected additional information from member museum websites. We developed a dataset from 90 children’s museums to see if there were differences in membership costs between small, medium, and large museums. We also compared admission prices across these categories and calculated a “pay less” point—that is, the number of times a family of four would need to visit in order to make the
purchase of an annual membership a cost-saving act.
Our analysis yielded two main findings. First, even though admission prices and membership costs are highest for large museums, the number of single visits needed by a family of four to “pay less” is lower for these museums than it is for their small and medium-sized counterparts. Second, we confirmed that admission prices and membership costs tend to rise in parallel, which means that even though base admission prices may be determined based on local cost of living concerns, ACM members can still compare their rates to other children’s museums, Taken together, these findings can help children’s museums determine how to align pricing decisions with the needs and interests of value-seeking visitors—that is, those who purchase memberships based on a calculation of savings.
In Spring 2022, the ACM Trends Team circulated a survey to ACM member institutions requesting data on attendance, admission prices, membership costs, and other operations. After supplementing this data with information gleaned from member websites in August 2022, we assembled a dataset of 90 museums (30 of each size). We summarize the data in Table 1 below.
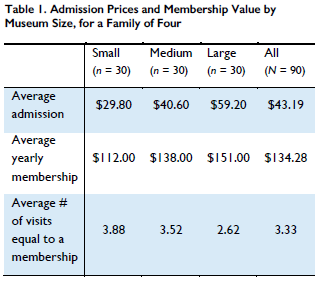
Table 1 compares admission and membership prices for a family of four at small, medium, and large museums. Admission prices are based on the general admission price for adults and children. When prices for adults and children were different, a family of four was calculated with two adults and two children.
We calculated these figures for a two-adult, two-child family on account of current US Census data (which shows that the average US family contains 3.13 people), and because this aligns with demographic research showing that a plurality of mothers in the US today report having two children (Pew Research Center, 2015).
The bottom row in Table 1 presents the average number of times a family of four would need to pay admission before achieving cost-savings through a membership purchase. The fourth column illustrates the mean cost across all size categories—which is an appropriate way to calculate averages in a dataset like this one, as it contains few outliers.
Clearly, the larger the museum, the higher the membership and admission costs for a family of four. Nevertheless, the number of visits needed for a valueseeker to “pay less” for multiple visits through a membership is lower (2.62) for large museums than for their small (3.88) and medium-sized (3.52) counterparts.
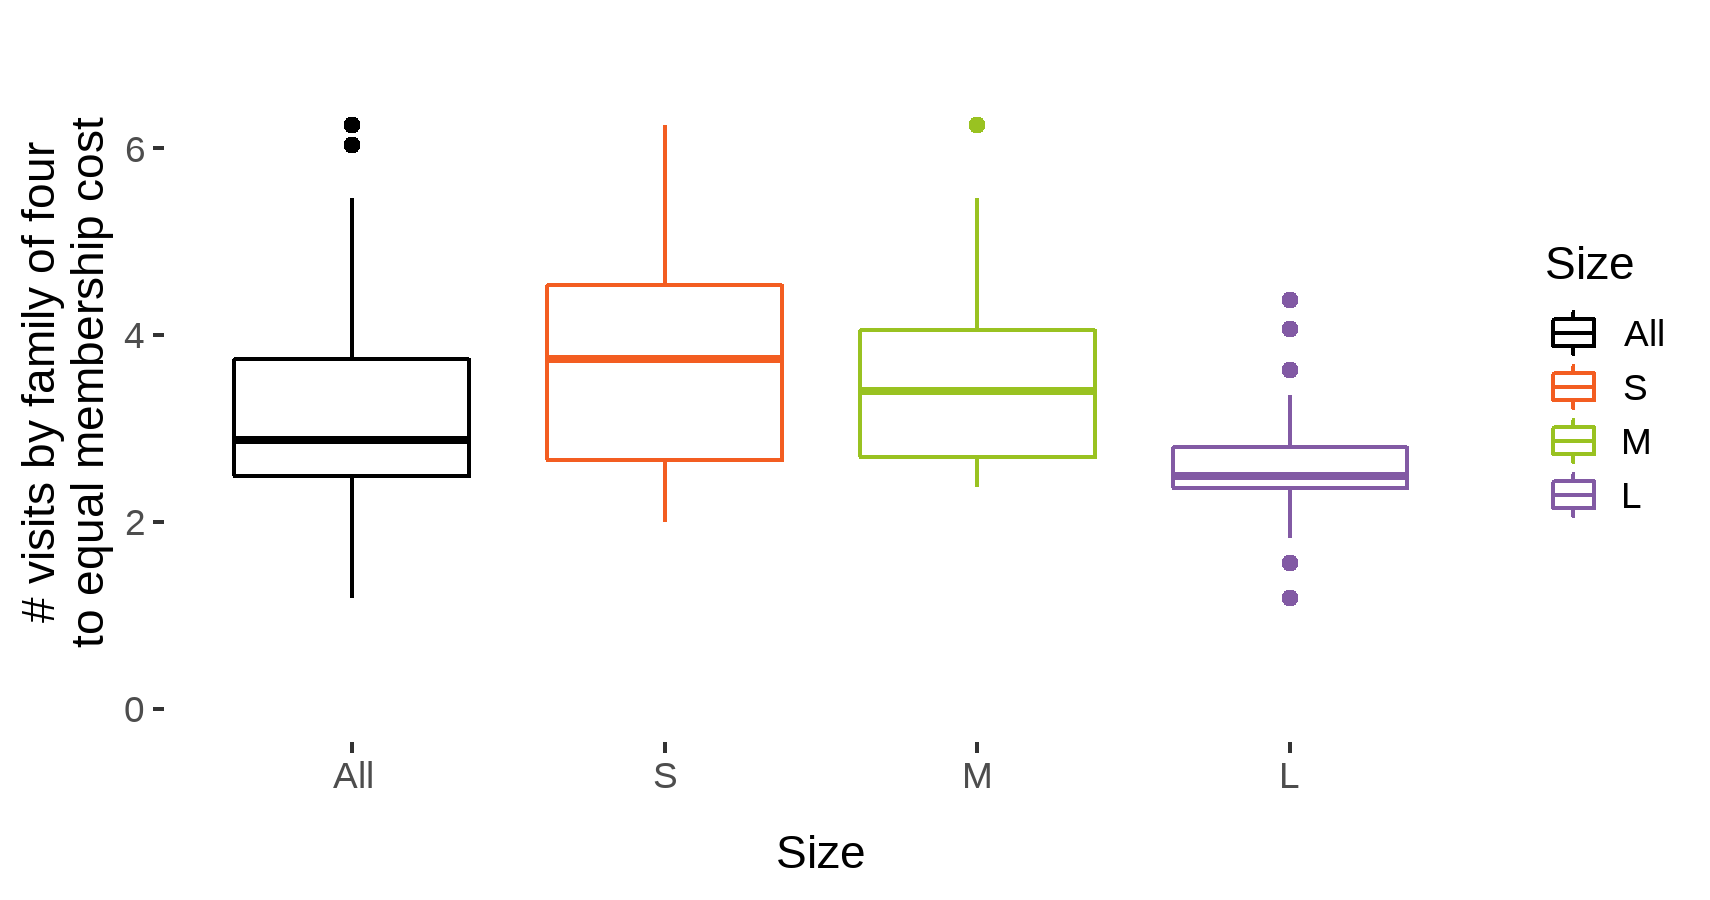
Figure 1 presents data from the bottom row of Table 1 as a “box and whiskers” plot. To create this, we “normalized” pricing data to show membership costs (for a family of four) as a multiple of admission costs for each children’s museum. The “box” part of the plot illustrates the middle half of the data (in other words, where 15 of the 30 museums in each size category sit), while the “whiskers” indicate those museums where prices are higher or lower than their peers.
When a museum stands alone compared to others, the box and whiskers plot expresses this with dots, considered outliers. When multiple museums lie in the same range, this is indicated by a line placed above the box. The line in the middle of the box illustrates the median, or the exact middle of all of the data in that category. We can see from those lines that medium-sized and small museums tend to be near one another. To see how many visits a family of four would need to make before generating savings through the purchase of a membership, look at the Y-axis, which plots the ratio of membership costs to visit price. This data can be used as a foundation for making decisions about membership pricing, especially in connection with data on premiums.
We also collected data on additional benefits provided with museum memberships—for example, discounts for rentals or birthday parties (n = 60), member-only events (n = 53), and reciprocal admission to other ACM (n = 24) or ASTC (n = 13) member institutions. Most museums offer these in some form; 8 out of 10 small museums, 9 out of 10 medium-sized museums, and all large museums indicated additional membership benefits. The total number of additional benefits did not appear to be related to a higher value of memberships.
One benefit, however, did have a significant effect on “trips to match cost.” Offering a discount on space rentals, after accounting for museum size, was related to higher membership costs. Though some have suggested that early access or discounts on summer camps are perceived as an incentive for families who can afford summer camp experiences, our analysis did not provide any evidence that the benefit is related to higher or lower membership prices.
We also looked at a subset of the data from fifty-one museums (1 small, 15 medium-sized, 20 large, and 3 yet to be classified) who responded to the Spring 2022 ACM member survey and provided information on annual attendance and member attendance from FY2016 to FY2021. Looking at the data, we can determine historical trends in museum attendance, and also calculate the proportion of overall attendance consisting of museum members.
Prior to the pandemic, in FY2016 through FY2019, the median number of memberships purchased per year for these museums was between 2200 and 3000. In FY2020 and FY2021, this value dropped to 968 & 1188 memberships purchased, respectively. Along with this decline, the proportion of overall visitors who were
museum members decreased roughly 6% in 2021 for these museums. While these museums are just a portion of the overall ACM field, the decline likely reflects the impact of the pandemic across the sector.
People purchase museum memberships for different reasons. These purchases provide a reason for frequent visits—which not only benefits children but can also help museum leaders advocate for children’s access to the healthy spaces of learning and discovery children’s museums provide. For some, a membership is a valueseeking purchase, one made through a consideration of future costs, benefits, and savings. Value-seekers become members because they want museum-going to be a regular part of their children’s lives. These pricing data tell us that museums anticipate four visits a year by their value-seeking members, setting prices that justify at least four or more visits in a membership year.
For others, purchasing a membership may not be driven by monetary concerns. They may simply want to invest in an institution that is doing good work, or to support a local institution that is good for children. Some individuals may purchase memberships to build social capital, because they want to support an organization whose values they identify with, and because they want their membership to reflect something about who they are. They may also become members because they want to encourage their grandchildren, nephews, nieces, or other relatives to visit them, or because they want to provide gifts to families with children. These “affinity members” may also care less about free admission than about membership perks, premiums, or about symbolic value—for example, discounts on birthdays or group tours, reciprocal admission at other ACM member museums or other cultural institutions, access to priority registration, exclusive programs, or behind-the-scenes content.
In other words, value is a complex, multidimensional thing. When thinking about those who see the primary value of a museum as its price, children’s museum leaders can also consider how decisions related to pricing might impact the perceived trustworthiness of their institutions. As ACM Trends #5.3 discussed, in order to cultivate public trust, museums need to demonstrate competence, reliability, sincerity, integrity, and benevolence. During the height of the pandemic, many museums demonstrated benevolence through refunds or by pro-rating existing memberships. At present, some museums are considering increased fees to recoup pandemic-related monetary losses. Doing so may risk the trust built through the pandemic, especially as cost-of-living increases may make more members value-seekers.
Data for this report was collected through: (1) an online survey distributed by ACM in April 2022; (2) a review of ACM member institutions’ websites. This dataset contains information from 90 current ACM member museums.
Our analysis used the size categories developed in ACM Trends Reports #1.1 and #1.7. We use these categories because institutional size predicts a range of outcomes for children’s museums. We note that museums offer many types of reduced priced tickets or free admission, and some unique premiums that were not used in this analysis.
Voiklis, J. (2022). Key Concepts: Trust. ACM Trends 5(3). Livingston, G. (2015). “Childlessness Falls, Family Size Grows Among Highly Education Women.” Pew Research Center.
US Census Bureau (2021). America’s Families and Living Arrangements. Retrieved from: [https://www.statista.com/statistics/183657/average-sizeof-
a-family-in-the-us/]
This project was made possible in part by the Institute of Museum and Library Services. The views, findings, conclusions or recommendations expressed in this publication do not necessarily represent those of the Institute of Museum and Library Services.
The Associations of Children’s Museums (ACM) champions children’s museums worldwide. Follow ACM on Twitter, Facebook, and Instagram. Knology produces practical social science for a better world. Follow Knology on Twitter.