January 27, 2022 / News & Blog
| This post was originally published as ACM Trends Report 4.14, the final report in the fourth volume of ACM Trends Reports, produced in partnership between ACM and Knology. |
This is the final report in the Museums in a Pandemic volume of the ACM Trends Report series. Since March 2020, the ACM Trends Report team has tracked the impacts of the pandemic on children’s museums through surveys, conversations, and other data collected by ACM. This ACM Trends Report presents data from museums that responded to our Spring 2021 survey.
Throughout the pandemic, we collected data on children’s museum operations and what was vital to their survival. We benchmarked this information against 2018 fiscal year 990 data. We used these data because 2018 represents the last pre-pandemic fiscal year for all of the organizations in our sample set. This comparison helped us understand the pandemic’s impact on museum operations.
As the pandemic continued into 2021, children’s museums were balancing re- opening to the public with the continued need to focus on securing necessary funding to keep operations going. We documented ACM members’ fundraising efforts in the early stages of the pandemic (ACM Trends #4.2 and #4.7).
By Spring 2021 many museums were welcoming visitors back into their spaces, with new safety protocols in place and varying capacity restrictions. Museums rely on these patrons to sustain operations. When we reviewed 2018 990 financial data from 218 museums in the ACM member network, our analysis showed that the median institution (regardless of size) relies on program services income (this includes income derived from admissions, events, and other general operational activities) for roughly 45% of its total income. Attendance directly impacts how museums balance income and expenses. By the time of this survey in Spring 2021, the numbers of visitors to the museums had not returned to pre-pandemic levels. This dip continues to impact children’s museums’ income.
To track how the field’s attendance had changed throughout the pandemic, we captured monthly total attendance numbers from March 2019 to March 2021. Sixty-two museums responded to this portion of our Spring 2021 survey. From this data set, we know that the average museum was open to in-person visitors for 34% of the total days during the pandemic’s first year than the year prior. Additionally, based on survey data from 52 museums, we know that in March 2021 attendance for the average museum remained at 26% of pre-pandemic attendance levels.
Knowing that museums rely on their patrons for 45% of their total income from program and services revenue, we asked for up-to-date data, as of March 2021, on fundraising during the pandemic. Specifically, we looked at governmental and non-governmental funding sources. As we reported in ACM Trends Report 4.7, the median value of funding from governmental sources in September 2020 was $205,000 (N = 96). Of the 96 museums responding, 77 had approached private funders (ACM Trends #4.13) with an average return of $50,000.
A second round of Paycheck Protection Program (PPP) funding was awarded in early 2021, in time for award announcements before the Spring survey. At this time, most museums responding to the survey (n = 80) reported moderate success in obtaining government funds during and related to the COVID-19 pandemic, exhibiting an 80% success rate with a median value of almost $400,000. Appeals for private funding were even more successful (98% success rate) but yielded smaller amounts, with a median value of just over $100,000.
Two new streams of funding were available to museums to apply for through the American Rescue Plan Act and the CARES Act. In March 2021, nearly one-third of museums (n = 27) indicated that they had applied or intended to apply for a Small Business Administration Shuttered Venue Operators Grants (SVO). At the time of the survey, SVO had not yet been distributed.
Additionally, just over one-third of museums (n = 32) indicated that they had received Employee Retention Tax Credit (ERTC) funds, with the median museum receiving $290,328. We have not collected further data on either the ERTC or SVO at this point.
Fundraising success is about more than securing grants. Museums are constantly looking for new funding sources and streams and setting goals to meet operating budgets. This remained true during the pandemic. Reviewing 218 museum’s 990 information, we found that the median museum relied on donations for almost half of their total income. In the Spring 2021 survey, we asked children’s museums whether their fundraising efforts were more successful, just as successful, or less successful during the first pandemic year (March 2020 – March 2021) compared to the previous year. Three-fourths of museums indicated that fundraising was just as or more successful during the first pandemic year (n = 79).
In Spring 2021, children’s museums were generally confident that they could meet their financial obligations one year on in Spring 2022. Eighty museums responded to the question “How confident do you feel that your museum will be able to maintain its financial obligations to maintain operations a year from now?” on a scale from Not at all confident to Very confident. Slider responses were recorded as numerals between 0.00 and 1.00, accordingly.
Seventy-three museums responded with a degree of confidence equal to or higher than 0.5, indicating that museums had found a way to compensate for the financial hit caused by drastically lower attendance numbers.
Government funding proved vital for many museums. Overall, their fundraising success during the pandemic seems to have stimulated children’s museums’ confidence.
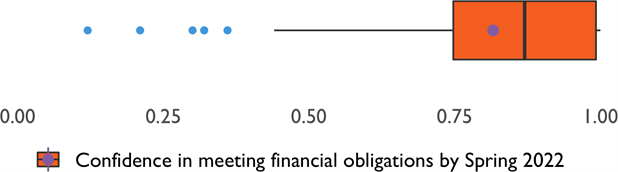
Figure 1.Confidence in meeting financial obligation by Spring 2022. (n = 80)
Figure 1 above is a Box and Whisker Plot displaying the responding museums’ confidence (n = 80). We will explain each element of the Box and Whisker Plot and what it shows about our data. Box and Whisker Plots are useful for displaying the range of values in a dataset, including the median value and quartiles of the data’s spread. Each quartile includes 25% of responding museums. Here, the orange box shows us the second quartile, the third quartile, and the median values of our data. The median is represented by the vertical line down the middle of the box. The left “side” of the box displays the second quartile, and the right “side” of the box displays the third quartile. The purple dot in the second quartile is the mean, or average value, of our data set. The whiskers, or the horizontal lines, on either side of the box show us the first and fourth quartiles. The five blue dots ranging between 0.10 and 0.45 are outliers.
So, what does all this mean in the context of museums’ confidence in meeting their financial obligations? By looking at the median, we can tell that the middle value of our data set represents a museum that is quite confident that it will meet its financial obligations in Spring 2022.
On a scale where a rating of Not at all confident yields a value of 0.00 and a rating of Very confident yields a value of 1.00, a median value of 0.85 reflects fairly high confidence. Meanwhile, the orange box tells us that half of the museums in the dataset, or 40 out of 80 museums, are moderately to very confident that they will meet their financial obligations in Spring 2022.
The short right whisker tells us that 20 museums are very confident in their ability to meet their financial obligations. Of the remaining 20 museums, five (represented by the blue dots) are less than confident about meeting their financial obligations. The box’s long left whisker shows that the first quartile of museums is somewhat confident in meeting their financial obligations. The takeaway is this: 75% of the museums in this data set are moderately to very confident that they can meet their financial obligations in Spring 2022. In the following sections, we explore the reasons for their optimism.
Every museum has a unique rationale for any confidence it has about its late- and post-pandemic future. However, we identified six general categories that illustrate why museums are right to feel confident. Thirty museums referenced a diversified funding stream, including federal and local government funding as well as private funding, as a reason for confidence. Twenty-seven museums have been encouraged by attendance during their re-opening phases and have received more visitors than anticipated. Twenty-three museums indicated that a reduction in operational spending as part of a long-term planning strategy, along with current cash reserves, meant they could be confident about meeting future operational needs.
Unfortunately, but unsurprisingly, reducing operation spending also included a reduction in staff. We detail the impacts of staffing over the course of the Pandemic in ACM Trends Report #4.12.
Additionally, seven museums in our data set either belong to a larger museum/university structure or are completely funded by local government and have moved to more sustainable budgets to ensure future operations. Finally, one museum mentioned that rent reduction has been helpful, and four museums moved into new spaces with higher capacity and lower operating costs.
In the past year, museums have reimagined their operations and service to their communities, and this has affected their staff. During an ACM Leadership call in Fall 2021, about 6-months after the Spring 2021 survey, ACM and Knology followed up with roughly 20 ACM member museum leaders to hear if they were still confident in meeting their operations’ budgets in 2022.
With attendance not yet back up to pre- pandemic levels, museum leaders’ confidence in meeting financial obligations in 2022 was high yet speculative. On a scale of 1 (least confident) to 5 (most confident), museum staff on the call indicated confidence between 3 and 5, with specific caveats and new concerns. Key concerns centered around the continued need for federal and state governmental funding to fill in the gaps of lowered earned revenue. Specifically, the Shuttered Venue Operating Grants and PPP loans were still covering many 2021 costs and were projected to continue to support museum operations into 2022. A second round of SVOG and funds from the Employee Retention Tax Credit were noted as potential future governmental funds that these museums were banking on. A museum CFO noted that, “Once the federal funding runs out, our confidence drops off tremendously not knowing which direction covid stats are going to go. Just when we thought it was getting back to ‘normal’ the Delta variant picked up. What’s next?” This was met with widespread agreement from others in attendance.
Museums staff noted that donations from individuals and foundations were starting to taper off, with many noting that perceived “sympathy giving” at the height of the pandemic in 2020 was not as common in Fall 2021. Many did not expect their fundraising to be as successful in 2022 compared to their early pandemic success.
We will continue to monitor the state of the children’s museum field into 2022 to understand how these concerns impact their missions and operations.
The data used in this report came from an online survey that ACM sent to US-based children’s museums. Overall, 91 museums responded to at least part of the survey. All participating museums were based in the US. Additional data was collected through an ACM Leadership call discussion forum where data was presented back to museum leaders for their response.
Flinner, K., Voiklis, J., Field, S., Attaway, E., Gupta, R., & Fraser, J. (2020). Museums in a Pandemic: Financial Impacts. ACM Trends 4(2).
Flinner, K., Voiklis, J., Field, S., Thomas, U.G, Attaway, E., & Gupta, R. (2021). Museums in a Pandemic: Diversifying Funding Streams. ACM Trends 4(7).
Flinner, K., Field, S., Voiklis, J., Thomas, U.G., & ACM Staff (2021). Museums in a Pandemic: Personnel & Rebuilding Teams. ACM Trends 4(12).
Fraser, J., Field, S., Voiklis, J., Attaway, E., & Thomas, U. G. (2021). Museums in a Pandemic: Patterns in Fundraising. ACM Trends 4(13).
This project was made possible in part by the Institute of Museum and Library Services. The views, findings, conclusions or recommendations expressed in this publication do not necessarily represent those of the Institute of Museum and Library Services.
The Associations of Children’s Museums (ACM) champions children’s museums worldwide. Follow ACM on Twitter, Facebook, and Instagram. Knology produces practical social science for a better world. Follow Knology on Twitter.